


Ever wondered what makes America tick? Beyond the headlines and daily buzz, the United States is a living, breathing tapestry of people, constantly evolving and shifting. These changes aren’t just abstract numbers; they paint a vivid picture of who we are, where we come from, and where we’re headed as a nation. It’s like watching a real-time blockbuster where the main characters are 340 million strong!
Get ready to dive deep into the fascinating world of U.S. demographics! We’re talking about the pulse of the nation, from how many people call America home to the languages they speak at the dinner table. If you’ve ever been curious about the incredible diversity and dynamic shifts shaping American life, you’re in for a treat.
So, buckle up! We’re about to unpack some seriously eye-opening facts about the American population. These aren’t just dry statistics; they’re the building blocks of our shared experience, offering insights into the vibrant, complex, and ever-changing story of the United States.
1. **The Ever-Growing Numbers: U.S. Population Milestones and Current Estimates**The sheer scale of the United States population is truly something to behold. According to the 2024 official estimate, a whopping 340,110,998 people currently reside in the nation. Looking ahead, the U.S. Census Bureau projects an even greater number, with the population reaching 342,034,432 by July 1, 2025. These figures firmly establish the United States as the most populous country in the Americas and the Western Hemisphere, a title it holds with significant gravitas.
But it’s not just about the present; America has been on a growth trajectory for centuries. Between the 2020 federal census count of 331,449,281 residents and the 2024 official estimate, the U.S. population expanded by 2.6%. This impressive growth includes the 50 states and Washington, D.C., though it’s important to remember that the 3.6 million residents of unincorporated U.S. territories like Puerto Rico and Guam are counted separately.
The country’s population growth rate, clocking in at 0.98% for the twelve-month period ending in July 2024, is an interesting point of comparison. While substantial, it was slightly below the world’s estimated annual growth rate of 1.03%. This steady increase has pushed the U.S. to become the third most populous country globally, accounting for approximately 4% of the world’s total population. It’s a remarkable testament to sustained growth over time.
Imagine the journey: the U.S. population almost quadrupled during the 20th century, surging from about 76 million in 1900 to 281 million in 2000, at an average growth rate of about 1.3% a year. Iconic milestones were achieved, with the 200 million mark crossed in 1967 and the 300 million mark reached on October 17, 2006. These numbers aren’t just statistics; they represent generations of dreams, innovations, and lives contributing to the nation’s vibrant story.

2. **America’s Age Snapshot: Understanding the Age Structure and Median Age**Peeling back the layers of the U.S. population, we find a fascinating distribution across different age groups, a snapshot that reveals both the youth and the aging wisdom within the nation. As of 2024 estimates, 21.5% of the population is under 18 years old, forming a vital foundation for the future. This youthfulness contrasts with other segments, creating a diverse age dynamic that keeps the country bustling with energy.
Moving up the age ladder, the 18–44 years age group constitutes the largest segment, standing at 36.0% as of 2023 estimates. This demographic represents a significant portion of the working-age population, driving much of the economic activity and cultural trends across the nation. They are the engine of today, shaping everything from technology to entertainment.
Then we have the experienced cohorts: the 45–64 years age group, making up 24.6% of the population in 2023, and those 65 and over, comprising 18% in the same year. The increasing proportion of the elderly population, in particular, highlights an ongoing societal shift. These shifts have profound implications for healthcare, social services, and even the labor market, as different generations bring their unique contributions and needs to the forefront.
Speaking of age, the median age of the total U.S. population provides a single, telling number. As of 2021, the median age stands at 38.8 years. Interestingly, there’s a slight but noticeable difference between genders, with males having a median age of 37.7 years and females at 39.8 years. This historical trend reflects many factors, including variations in life expectancy and birth rates across time. It tells a story of an aging population, a trend that has been consistently observed through history, moving from a median age of 16.7 in 1820 to today’s figures.

3. **The Gender Balance: A Look at Sex Ratios Across the U.S.**When we look at the balance between males and females in the United States, we uncover some interesting patterns that vary by age and overall population. The total ratio for the country in 2023 was estimated at 0.98 male(s) per female, indicating a slight numerical advantage for females across the entire population. This overall statistic is a result of various factors throughout the life cycle.
However, this balance isn’t consistent from birth. At birth, males actually outnumber females, with a ratio of 1.045 male(s) per female in 2022. This trend of more male births is a biological constant observed across many populations worldwide. This initial slight male majority gradually shifts as individuals age, leading to a different dynamic in older cohorts.
The shift in ratio becomes quite noticeable as we examine different age brackets. For those under 15 years, the ratio is 1.05 male(s) per female (2023 est.), maintaining a male majority. In the 15–64 years age group, the ratio remains close to even at 1.01 male(s) per female (2023 est.). However, a significant reversal occurs in the 65 and over age group, where the ratio drops to 0.82 male(s) per female (2023 est.). This pronounced difference in older ages is typically attributed to longer female life expectancy.
Historically, the U.S. Census has shown an evolving distribution. The 2020 U.S. Census reported that females made up 50.9% (or 168,763,470 people) of the population, while males accounted for 49.1% (or 162,685,811 people). This continues a trend observed since the 1950 Census, which was the first time the United States reported more females than males. It’s a subtle yet profound shift that underscores changing societal and biological realities over the decades.

4. **A Rich Tapestry: Major Ethnic Groups Shaping the American Identity**One of the most defining characteristics of the United States is its incredible ethnic diversity, truly a mosaic of cultures and origins. The fabric of the nation is woven from countless threads, with several major ethnic groups forming the foundational patterns. As of 2020, people who identified as white alone, including Hispanic whites, numbered 204,277,273 or 61.6% of the population, reflecting a significant majority, though non-Latino whites made up 57.8% of the country’s population.
Among white Americans, a deep dive into ancestry reveals a fascinating array of origins. Britons, including English, Scots, Scots-Irish, and Welsh, account for 8.42% of the population. Germans follow closely at 4.69%, with a small segment identified as Pennsylvania Germans. White Hispanics, a distinct and growing group, represent 3.80% of the population, including those of Spanish descent. These figures highlight the enduring legacy of European immigration and its profound influence on the American demographic landscape.
But the story of American identity is far from monochromatic. Blacks constitute 12.40% of the population, a significant demographic with a rich and complex history. The past century has seen dramatic shifts in their distribution, as in 1900, 8.8 million Black Americans were in the United States, with about 90% of them still living in Southern states. This group has been a foundational pillar of the nation’s cultural and social development.
Asian Americans, representing 6.00% of the population, are recognized as the fastest-growing racial group in the United States, boasting an impressive growth rate of 35%. This growth is concentrated in various subgroups, reflecting diverse origins and contributions to American society. Their rapid increase is a testament to recent immigration patterns and changing global connections.
Rounding out the major groups, individuals identifying as Mixed race account for 10.21% of the population, showcasing the increasing intermixing of different ethnic backgrounds. This category includes a substantial portion of Mixed Hispanics at 6.12%. This phenomenon of growing multi-racial identity is a powerful indicator of America’s ongoing evolution, illustrating a future that is even more integrated and diverse than ever before.
Read more about: Work Until You Drop? A Deep Dive into the Foundational Pressures Shaping America’s Evolving Work and Retirement Landscape

5. **Beyond the Big Picture: Exploring Minor Ethnic Groups in the U.S.**While the major ethnic categories provide a broad understanding, the true depth of American diversity emerges when we explore the myriad of minor ethnic groups that contribute to the nation’s vibrant cultural mosaic. These smaller, yet equally significant, communities enrich the social fabric with unique traditions, languages, and histories, making the U.S. truly a global village.
Within the Black population, beyond the general designation, we find specific communities with distinct origins. Black Hispanics, for example, make up 0.35% of the population, bringing a blend of Afro-Caribbean and Latin American heritage. Other notable groups include Haitians (0.28%), Jamaicans (0.24%), and Nigerians (0.15%), each contributing their rich cultural narratives to the broader American story.
The Asian American community, already highlighted as the fastest-growing, is incredibly diverse within itself. East, Central, and Southeast Asians comprise 4.18% of the total U.S. population, with distinct national origins such as Chinese (1.25%), Filipinos (0.93%), Vietnamese (0.59%), Koreans (0.46%), and Japanese (0.22%). Separately, South Asians account for 1.74%, notably Indians (1.33%) and Pakistanis (0.19%), demonstrating the vast geographical and cultural spread of this vibrant community.
Native Americans, an indigenous people with deep roots in the land, represent 1.12% of the population. This category includes Native Hispanics (0.45%), with ancestral connections to groups like the Aztecs (0.12%) and Mayas (0.06%). Other prominent Native American nations, such as the Navajos (0.12%) and Cherokees (0.07%), contribute to the profound historical and cultural legacy of the continent. Their stories are central to understanding the full scope of American heritage.
Finally, the Islander population, though a smaller percentage at 0.21%, adds another layer of distinctive identity to the U.S. This group includes Hawaiians (0.06%) and Samoans (0.04%), along with Islander Hispanics (0.02%). These communities, hailing from various islands and territories, bring unique Pacific cultures and perspectives, further illustrating that America’s diversity is not just continental but extends across oceans, connecting it to a global tapestry of human experience.

6. **The Language Landscape: What Americans Speak at Home**Understanding the linguistic landscape of the United States offers another fascinating glimpse into its demographic composition. While English is undoubtedly the dominant language, a rich symphony of tongues is spoken in homes across the nation, reflecting its diverse population and immigration history. English is spoken by 78.5% of the population as the primary language at home, clearly establishing its widespread use.
However, the country’s linguistic diversity is immediately apparent when we consider Spanish, which is spoken by 13.2% of the population at home. This makes Spanish the second most common language and highlights the significant cultural and demographic ties to Latin America. Beyond these two, other Indo-European languages are spoken by 3.7% of households, while Asian and Pacific Islander languages account for 3.3%. This vibrant mix of languages spoken in daily life contributes to the nation’s multicultural character.
Interestingly, the official status of English in the U.S. has a unique history. An Executive Order in 2025 made English the official language of the United States. However, it’s worth noting that Congress has never passed a bill to designate English as the official language across all three federal branches. This creates a nuanced situation where English is indeed prominent, but other languages also hold official status in various regions.
For instance, English is designated as official in 32 of the 50 states and all five U.S. territories. But there are notable exceptions that celebrate linguistic heritage: Hawaiian is official in Hawaii, 20 Native languages are official in Alaska, and Sioux is official in South Dakota. Furthermore, Samoan holds official status in American Samoa, Chamorro is official in Guam, Chamorro and Carolinian are official in the Northern Mariana Islands, and Spanish is an official language in Puerto Rico. This multi-layered linguistic reality truly showcases America’s embrace of its varied heritage.
Ready for even more insights into America’s ever-evolving story? We’ve already explored the fundamental building blocks of the U.S. population, from its sheer size to the languages echoing in its homes. Now, let’s dive into the dynamic forces constantly reshaping this incredible nation—think of it as the demographic action sequence! We’re talking about the game-changers: how immigration is transforming everything, the surprising shifts in how families are formed, where everyone’s choosing to live, and what all these changes mean for the economy. Get ready, because these next six points are going to show you just how much America is a living, breathing, and always-changing masterpiece!
Read more about: The Echoes of Giants: How Enduring Literature Navigates a Fragmented World and a Shifting Cultural Landscape

7. **The Mighty Influence of Immigration: A Nation Reimagined**Immigration has always been a vital thread in the American tapestry, but its transformative impact in recent decades has been nothing short of phenomenal. The foreign-born population, for example, nearly doubled from almost 20 million in 1990 to over 45 million by 2015, illustrating a massive influx of new residents. This isn’t just a side note; it represents a full one-third of the total U.S. population increase during that period, showing just how significant new arrivals have been to the nation’s growth.
Here’s a fascinating twist: the U.S. Census Bureau reported in late 2024 that recent international migration has actually *more than offset* the country’s lower birth and fertility rates. This is a big deal! It means that “Net international migration’s influence on population trends has increased over the last few years. Since 2021, it accounted for the majority of the nation’s growth—a departure from the last two decades, when natural increase was the main factor.” This shift highlights immigration as the new primary engine of population expansion.
And it’s not just about numbers; immigration is actively boosting our population year after year. This trend has directly contributed to notable increases in the U.S. population in recent years, with growth rates of +0.58% in 2022, +0.83% in 2023, and +0.98% in 2024. These figures underscore the immediate and ongoing contribution of immigrants to America’s demographic vitality, keeping the country vibrant and growing.
But this isn’t a new phenomenon; it’s a continuation of historical patterns. Thanks to federal laws like the Immigration and Nationality Act of 1965, the number of first-generation immigrants living in the United States steadily climbed from 9.6 million in 1970 to about 38 million in 2007. We’re talking about an amazing increase in people choosing to make America their home, with around a million individuals legally immigrating per year in the 1990s, a significant jump from 250,000 per year in the 1950s. Talk about a warm welcome!
Looking at specific groups, Latino Americans are at the forefront of this demographic transformation. They accounted for a staggering 51.1% of the country’s total population growth between 2010 and 2020, with their population expanding from 50.5 million to 62.1 million. That’s a 23% increase and a numerical gain of more than 11.6 million people in just one decade! It’s clear that immigrants and their U.S.-born descendants are poised to drive the majority of U.S. population gains for decades to come, ensuring a future rich in diversity and new perspectives.

8. **The Rollercoaster of Births: Unpacking America’s Fertility Story**Ever wonder how many babies are being born in America and what that means for our future? Well, the nation’s fertility patterns are telling a compelling story of change. For starters, the U.S. birth rate has remained persistently below the replacement level, which is at least 2.1 children per woman—the number needed to simply maintain the population without immigration. This is a crucial benchmark that shows where our natural population growth stands.
The shifts aren’t uniform across all groups, adding layers of complexity to the picture. As of 2017, for instance, births to white American mothers declined in every single state and Washington, D.C. In fact, among non-Hispanic white women, not a single state recorded a fertility rate above that crucial replacement level. This contrasts sharply with other groups, where 12 states saw non-Hispanic Black women reaching above the replacement level, and a remarkable 29 states did for Hispanic women. Talk about different trends!
Delving into specifics, the highest total fertility rate (TFR) for non-Hispanic white women was in Utah at 2.099, while the lowest was in the District of Columbia at a slim 1.012. For non-Hispanic Black women, the TFR soared to 4.003 in Maine, though it dipped to 1.146 in Wyoming. Hispanic women also showed a wide range, with the highest TFR in Alabama at 3.085 and the lowest in Vermont at 1.200 and Maine at 1.281. These variations underline the diverse demographic experiences across the country.
Economic factors, too, play a significant role. The drop in the birth rate from 2007 to 2009 is largely linked to the Great Recession, showing how big life decisions are often connected to financial stability. Births fell by 4% during that period, marking the largest two-year decline since the 1970s. This downward trend continued for three consecutive years, with births eventually settling 7% below their 2007 peak and reaching levels comparable to the Great Depression of the 1930s. What a historical parallel!
It’s also worth noting the dramatic changes in teen birth rates, which are now at their lowest level in U.S. history. While there was a brief uptick between 2005 and 2007, and a 6% decrease for 15- to 19-year-olds between 2008 and 2009, the overall decline has been consistent since 1991 through 2011. Despite this progress, U.S. teen birth rates still remain higher than those in many other developed nations, with notable racial differences persisting, as American Indian/Alaska Native, Hispanic, and non-Hispanic Black teen pregnancy rates are more than double those of non-Hispanic white teens.

9. **Tying the Knot (or Not): America’s Evolving Marriage Landscape**Marriage and family structures in the U.S. are anything but static; they’re constantly evolving, reflecting broader societal shifts. The numbers tell an interesting story: in 2020, the CDC reported 1,676,911 marriages, a noticeable decrease from the 2,015,603 recorded in 2019. This dip reflects a changing landscape, where traditional norms are giving way to new patterns of partnership and family formation.
Marriage rates aren’t a one-size-fits-all phenomenon across the country either. They vary significantly from state to state, showing a mosaic of local customs and preferences. For instance, in 2020, California had a provisional rate of just 3.2 marriages per 1,000 population, while the bright lights of Nevada saw a bustling 21.0 marriages per 1,000 population! These extremes highlight the diverse approaches to tying the knot (or opting out) across different regions.
Beyond just the number of marriages, there’s a significant trend in births to unmarried women, which points to profound changes in family dynamics. Back in 2009, Time magazine reported that 40% of all births were to unmarried women. This figure was broken down further by race: 17% for Asian women, 29% for White women, 53% for Hispanic women (of any race), 66% for Native American women, and a striking 72% for Black American women. These statistics underscore how diverse family structures have become a fundamental part of the American experience.
Fast forward to 2020, and the CDC found that at least 1,461,121 births were to unmarried women, making up 40.5% of all births that year. While the overall percentage remained similar to 2009, the racial breakdown shifted slightly: 28.4% for Non-Hispanic White women, 70.4% for Non-Hispanic Black women, and 52.8% for Hispanic women (of any race). These updated figures continue to highlight the ongoing demographic transformation of what constitutes a family in America, proving that love and partnership come in many forms.
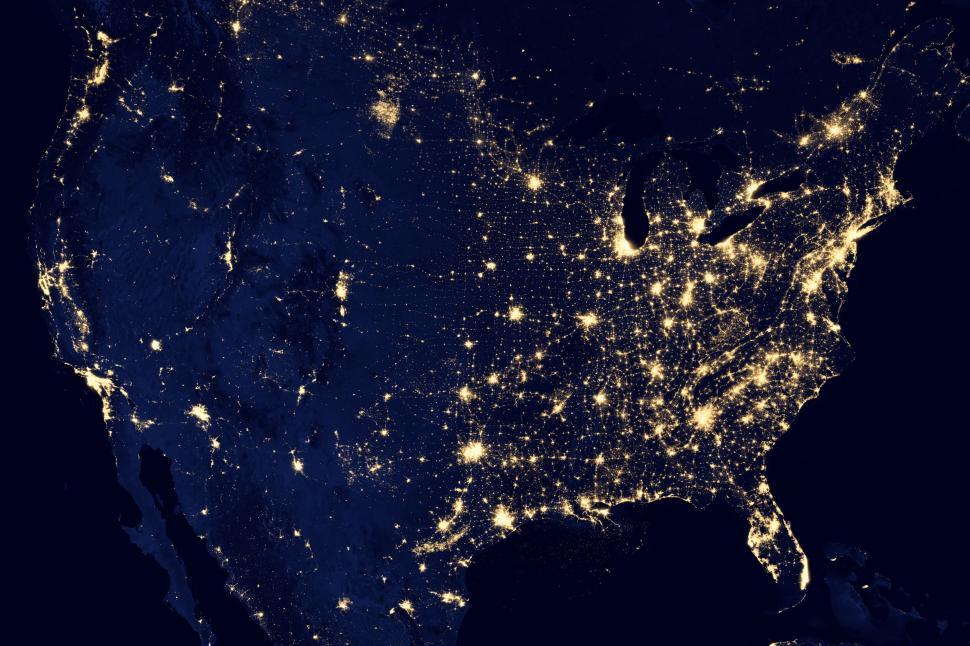
10. **Squeezing In or Spreading Out: Understanding U.S. Population Density**Ever feel like you’re surrounded by people, or sometimes like you have the whole world to yourself? That’s the story of population density in the U.S., a country that spans a vast geographical area but has unevenly distributed inhabitants. The overall density of the United States is 86.16 people per square mile (or 33.27 per square kilometer), which gives you a broad idea, but the real fun is in the details!
When we zoom in, the picture changes dramatically. New Jersey takes the crown as the most densely populated state, packing in an impressive 1,263 people per square mile (488 per square kilometer). This high concentration is a stark contrast to the national average and speaks to intense urbanization in certain regions. It’s like comparing a bustling city street to a quiet country lane!
Indeed, the U.S. population is highly urbanized, with a whopping 83.3% of residents choosing to live in cities and their surrounding suburbs. This means most of us are clustered together, enjoying the conveniences and opportunities that urban life offers. It’s a testament to the magnetic pull of metropolitan areas where life hums with energy and activity.
Urban clusters are generally spread throughout the eastern half of the United States, particularly around the Great Lakes area, the northeast, the east, and the southeast. You’ll also find significant urban populations in the western tier states. However, large swaths of the country remain less densely populated, including the majestic Rocky Mountains and Appalachian chain, the sprawling deserts in the southwest, the dense boreal forests in the extreme north, and the vast central prairie states. Each region offers a unique living experience, from packed cityscapes to wide-open spaces.
Even in far-flung locales, population density follows interesting patterns. For example, Alaska’s population tends to be concentrated along its southern coast, with Anchorage being a particular hotspot. Similarly, Hawaii’s population is primarily centered on the beautiful island of Oahu. And speaking of populous states, California and Texas lead the pack, demonstrating a consistent westward and southward shift in the mean center of the U.S. population. It’s like a slow, steady migration of America’s heartland over time!

11. **City Lights and Urban Sprawl: America’s Population Centers**If you love city life, you’re in good company, because America is a nation of urban dwellers! As we just explored, 83.3% of the U.S. population lives in cities and suburbs, creating bustling hubs of activity, culture, and innovation. The United States boasts dozens of major cities, including an impressive 31 “global cities” of all types. That’s a lot of urban energy concentrated in specific spots across the map!
Among these global cities, a prestigious “alpha” group of 10 stands out, recognized for their significant international influence: New York, Los Angeles, Chicago, Washington, D.C., Boston, San Francisco, Miami, Philadelphia, Dallas, and Atlanta. These aren’t just big cities; they’re powerhouses that drive global trends and attract people from all corners of the world. It’s like the ultimate urban dream team!
In fact, as of 2021, the United States was home to 56 metropolitan areas with a million or more inhabitants, ranging from the colossal to the still-impressive. Even Urban Honolulu, way out in the Pacific, made the list as the 56th most populous area with just over a million residents. What’s truly mind-boggling is that as of 2011, about 250 million Americans lived in or around urban areas, meaning more than three-quarters of the U.S. population shares just about three percent of the country’s vast land area! Talk about making the most of a small footprint.
Speaking of the big players, New York City has held the title of the most populous city in the United States since at least 1790—that’s some serious staying power! But it’s not alone in drawing massive crowds. When we look at the largest metropolitan areas, the numbers are truly staggering: New York itself leads with nearly 20 million residents, followed by Los Angeles with over 12.9 million, Chicago with 9.4 million, Dallas–Fort Worth with 8.3 million, and Houston with 7.7 million. These urban giants are shaping the future of American life.
And let’s not forget our U.S. territories, which also have their own vibrant population centers. The San Juan metro area in Puerto Rico, Saipan in the Northern Mariana Islands, and the island of Tutuila in American Samoa are crucial hubs for their respective regions. These centers, whether continental or island-based, underscore the dynamic and diverse ways Americans gather and thrive across the nation.
Read more about: Beyond the Metropolitan Sprawl: Unpacking the Thriving Renaissance of Fast Food in Small-Town America
12. **The Age Equation: Decoding Dependency Ratios and Economic Futures**Ever thought about how many working-age people are supporting the rest of us? That’s where dependency ratios come in, and they offer a super interesting glimpse into the economic future of a nation. Essentially, the dependency ratio is a way to gauge the strain on the productive population (those aged 15 to 64) by comparing them to those normally not in the labor force (the dependent population, which includes individuals aged 0 to 14 and 65 and older). It’s a vital metric for understanding societal support systems.
Digging a bit deeper, we can break this down into different types. The “child dependency ratio” focuses on the young, while the “aged dependency ratio” looks at the elderly. And for an even brighter outlook, there’s the “potential support ratio,” which is the inverse of the aged dependency ratio—it tells you how many working-age individuals are available to support each older person. Globally, the U.S. total dependency ratio ranked 110th in 2021, while its child dependency ratio was 138th. However, its aged dependency ratio was a more prominent 42nd, and the potential support ratio stood at 160th, indicating an important shift towards an older population needing support.
These ratios are directly impacted by the age structure we discussed earlier. With 21.5% of the population under 18 and 18% aged 65 and over (as of 2024 and 2023 estimates, respectively), while the 18-64 age group comprises the majority, the increasing proportion of the elderly population is a key factor. The median age of the U.S. population rising from a youthful 16.7 years in 1820 to 38.8 years in 2021 clearly points to an aging society, which inevitably influences these dependency figures.
Historically, the shifts are quite telling. Looking back from 1900 to 2015, the percentage of the population aged 0-14 years decreased significantly from 34.5% to 19.8%. In contrast, the 65 years and over age group saw a substantial increase from just 4.1% to 14.3% during the same period. These changes mean a smaller proportion of younger dependents and a much larger proportion of older dependents relative to the working-age population, which creates new challenges and opportunities for the economy and social services. It’s like our demographic scales are constantly re-balancing!
So there you have it—a deep dive into the fascinating, ever-changing demographics of the United States! From soaring populations and shifting ethnic mosaics to evolving family dynamics and the economic currents shaped by age, America is a truly vibrant and dynamic nation. These numbers aren’t just statistics; they’re the heartbeat of a country continuously reinventing itself, a testament to the millions of stories that make up its incredible journey. What an exciting time to be an American, witnessing these profound transformations firsthand! Keep an eye on these trends, because they’re painting the picture of tomorrow, today.


