

There’s nothing quite like the heart-sinking feeling when your trusty digital companion, your personal computer, decides to stage a silent protest. One moment you’re breezing through tasks, perhaps enjoying the sleekness of your updated KDE Plasma desktop, and the next, everything simply… stops. Your screen freezes, the keyboard goes unresponsive, and even the touchpad ignores your frantic attempts to regain control. It’s an abrupt, total halt, leaving you with no option but the dreaded seven-second power button press – the digital equivalent of pulling the plug on a critical operation.
This isn’t just a minor hiccup or a fleeting bug; it’s a full-blown system meltdown, a digital ‘fleet accident’ that wipes out your entire workflow. Imagine your crucial data pipelines suddenly choked, your creative endeavors frozen in time, all due to an update meant to improve things. This particular saga unfolds on a Manjaro Linux system, specifically after an upgrade from Plasma 5 to Plasma 6, transforming what should have been an enhancement into a perplexing parade of freezes. We’re going to dive deep into the cryptic messages left behind in the system logs, acting as digital detectives to uncover the root causes of these severe glitches.
These logs are like the black boxes of an aircraft, recording every last detail leading up to a critical incident. They provide us with a treasure trove of clues, pointing towards a cocktail of issues ranging from graphical subsystem failures and file indexing woes to deeper kernel-level hardware communication breakdowns and operating system resource exhaustion. Each error message, each warning, is a piece of the puzzle, and together, they paint a comprehensive picture of how a sophisticated system can spiral into total unresponsiveness. Let’s unmask the culprits behind these frustrating freezes, one critical component at a time, to understand how your digital life can suddenly grind to a halt.

1. **KWin_X11 BadDamage XCB Errors**Our first major red flag comes from `kwin_x11`, the powerhouse behind the KDE Plasma desktop’s visual experience. KWin is your window manager and compositor, responsible for drawing everything you see on your screen, from application windows to desktop effects. When KWin starts throwing errors, especially repeated ones like “`kwin_core: XCB error: 152 (BadDamage), sequence: XXX, resource id: YYY, major code: 143 (DAMAGE), minor code: 3 (Subtract)`,” it’s a clear sign that the graphical rendering pipeline is encountering significant trouble. These errors indicate that KWin is trying to update parts of the screen, but it’s receiving corrupted or invalid data, or perhaps trying to interact with a display resource that is no longer valid or accessible.
The `BadDamage` error, specifically, refers to issues with the X Damage extension, which is used to track changes to windows and efficiently redraw only the affected areas. When KWin reports `BadDamage`, it means it’s unable to accurately determine what parts of the screen need redrawing or that the information it has about those areas is inconsistent. This can lead to visual artifacts, incomplete screen updates, or, in severe cases like this, a complete graphical freeze as the compositor struggles to reconcile the state of your display. It’s like trying to paint a picture when your canvas keeps morphing beneath your brush.
Given the context of a Plasma 5 to Plasma 6 upgrade, these `BadDamage` errors are particularly telling. Plasma 6 introduces significant changes, including an upgrade to Qt 6 and a general refactoring of the desktop environment. Such major architectural shifts can sometimes introduce incompatibilities or subtle bugs in how KWin interacts with the underlying X server and graphics drivers. The continuous stream of these errors in the logs suggests a persistent and fundamental breakdown in the system’s ability to render and manage its graphical output, making it a prime suspect in our freezing investigation. It’s a foundational crack in the visual façade of the desktop.
2. **Baloo File Extractor Poller Plugin & Nullptr Connect Errors**Next on our list of digital distress signals, we find multiple entries related to `baloo_file_extractor`. Baloo is KDE’s file indexing and search framework, running quietly in the background to make your files easily discoverable. It constantly monitors your file system for changes, indexing content and metadata. However, the logs show a recurring pattern of errors: “`kf.idletime: Could not find any system poller plugin`” and “`qt.core.qobject.connect: QObject::connect(KAbstractIdleTimePoller, KIdleTime): invalid nullptr parameter`.” These messages point to a problem with how Baloo is trying to manage its workload and integrate with the system.
The first error, `Could not find any system poller plugin`, indicates that Baloo is unable to locate a necessary component that helps it determine when the system is idle. This ‘idle time poller’ is crucial for Baloo to know when it’s safe to perform its resource-intensive indexing tasks without impacting user experience. If it can’t find this plugin, Baloo might either operate inefficiently, consuming resources when it shouldn’t, or simply fail to function correctly. This could lead to a backlog of indexing tasks or a continuous struggle to initiate its operations, contributing to overall system sluggishness or unresponsiveness.
The `invalid nullptr parameter` messages further compound this issue, suggesting that Baloo is attempting to establish a connection (a `QObject::connect` call, common in Qt applications) to a non-existent or null object related to its idle time management. This is a classic programming error where a pointer to an object is unexpectedly null, leading to a failed operation. In essence, Baloo is trying to communicate with a part of the system that isn’t there or hasn’t been properly initialized. This consistent failure indicates a deep integration problem, potentially stemming from the Plasma 6 upgrade where older components might be missing or new ones are expected but not properly linked. It’s like a critical sensor in your digital ‘vehicle’ being unplugged, making intelligent operation impossible.
3. **Plasmashell Binding Loop in Media Controller QML**Moving on, `plasmashell` itself, the core of your KDE desktop experience, reports some concerning behavior: “`file:///usr/share/plasma/plasmoids/org.kde.plasma.mediacontroller/contents/ui/ExpandedRepresentation.qml:648:13: QML PlasmoidHeading: Binding loop detected for property ‘leftInset’`.” This is another intriguing piece of the puzzle, indicating a specific issue within a QML component of the Plasma desktop, particularly the media controller plasmoid.
QML (Qt Meta-Object Language) is a declarative language used for designing user interfaces, and ‘bindings’ are fundamental to how QML components react to changes in data or other properties. A ‘binding loop’ occurs when two or more properties are defined in such a way that they continuously try to update each other, creating an infinite cycle. In this case, a property like `leftInset` (which controls spacing or positioning) within the `ExpandedRepresentation.qml` of the media controller is caught in such a loop. This isn’t just a cosmetic glitch; it can be a significant performance drain.
Imagine a perpetually spinning wheel in the background, constantly recalculating something that never settles. A binding loop consumes CPU cycles and potentially GPU resources unnecessarily, as the system tries endlessly to resolve the conflicting property updates. If this loop is severe enough or occurs frequently, it can lead to noticeable slowdowns, high CPU usage, and unresponsiveness, especially within the graphical shell. The media controller might become sluggish, or its constant activity could starve other essential processes of resources. It’s akin to a faulty gauge on a control panel, constantly flickering and consuming power without providing useful information, ultimately distracting the whole system.
4. **Kernel Radeon AtomBIOS Stuck Errors**Now we delve into some truly critical errors originating directly from the kernel and impacting the graphics hardware. The `radeon` driver, responsible for managing your AMD GPU (in this case, an AMD Sun XT [Radeon HD 8670A/8670M/8690M / R5 M330 M430 Radeon 520 Mobile]), reports a dire situation: “`[drm:atom_op_jump [radeon]] *ERROR* atombios stuck in loop for more than 5secs aborting`” and subsequent `atombios stuck executing` messages. AtomBIOS is the low-level firmware that initializes and controls the basic functions of older AMD Radeon graphics cards, handling crucial tasks like setting display modes and power management.
When AtomBIOS gets “stuck in a loop,” it signifies a catastrophic failure at the firmware level of the graphics card. This means the GPU’s fundamental operating instructions are caught in an endless cycle, preventing it from performing its core functions. It’s like the initial boot sequence of an engine failing to complete, leaving the entire system inert. The repeated occurrences of these errors, sometimes multiple times within minutes as seen in the logs, confirm a persistent and severe inability of the Radeon GPU to initialize or respond correctly. This isn’t a software bug alone; it points to a deep communication or functional issue with the hardware itself or how the driver interacts with that firmware.
The `aborting` message is the system’s desperate attempt to recover from this unresolvable state, but as the freezes indicate, these attempts are often futile. Such a profound graphics card issue will inevitably lead to a frozen display because the primary component responsible for rendering *anything* on your screen is incapacitated. Coupled with the fact that this system has dual graphics (Intel HD Graphics 5500 and AMD Radeon), there might be complex interactions or power management conflicts between the two GPUs that are exacerbated by the Plasma 6 upgrade or the kernel version. This level of error is a direct, undeniable cause of total display failure.
5. **Kernel Radeon MC Idle Timedout**Following closely on the heels of the AtomBIOS errors, we encounter another grave warning from the Radeon driver: “`radeon 0000:0a:00.0: Wait for MC idle timedout !`” This specific message indicates a failure within the graphics card’s Memory Controller (MC). The memory controller is a vital component of the GPU, responsible for managing all memory access operations, including reading and writing data to the GPU’s dedicated video RAM (VRAM). It ensures that the GPU can efficiently store and retrieve the massive amounts of data required for rendering graphics, textures, and video frames.
When the system reports a “`Wait for MC idle timedout`,” it means that the Radeon driver issued a command to the memory controller and then waited for it to become idle (i.e., finish its current tasks) before proceeding with further operations. However, the memory controller failed to signal that it had become idle within the expected timeframe, leading to a timeout. This is a critical sign that the memory controller is either completely unresponsive, severely overloaded, or stuck in its own internal loop. Essentially, the GPU’s ability to interact with its own memory is compromised, which is fundamental to its operation.
This error is often a consequence of or runs in parallel with the AtomBIOS issues. If AtomBIOS cannot properly initialize the GPU, or if the GPU experiences internal corruption, the memory controller could easily become unresponsive. Without a functioning memory controller, the GPU cannot process or display any graphics. It’s like a central command center for logistics going completely offline; no supplies can move, and no orders can be executed. This failure alone is sufficient to cause a complete system freeze, especially when the display relies entirely on the GPU’s operational integrity. This points to a deeply seated issue, possibly even a hardware degradation or an incompatible driver interaction with an older GPU model, intensified by the recent system changes.

6. **Kernel Radeon Ring Test Failed**To cap off our exploration of the Radeon GPU’s woes, the logs present yet another dire diagnostic: “`[drm:r600_ring_test [radeon]] *ERROR* radeon: ring 0 test failed (scratch(0x850C)=0xCAFEDEAD)`” and “`[drm:si_resume [radeon]] *ERROR* si startup failed on resume`.” These messages are essentially a confirmation that the AMD GPU is dead in the water, unable to perform even its most basic self-diagnostic functions. Graphics processing units operate by queuing commands into different ‘rings’ or command buffers. Ring 0 typically refers to the primary graphics command ring, responsible for core 3D rendering and display output.
The “`ring 0 test failed`” indicates that the Radeon driver attempted to perform an internal test on this crucial command ring, but it did not receive the expected result. The specific value `0xCAFEDEAD` is often a debugging signature or a ‘magic number’ used by developers. In this context, it usually signifies that a memory region or register that should have been written to during the test, and then read back, either contains unexpected data or is entirely uninitialized, indicating a fundamental breakdown. It’s a clear signal that the GPU’s internal command processing mechanism is not working correctly, rendering it incapable of executing any graphics commands.
The subsequent “`si startup failed on resume`” error (where ‘si’ likely refers to Southern Islands, the codename for the GPU’s architecture) is a direct consequence. If the GPU’s fundamental command rings are failing tests, it cannot properly resume its operation after being initialized or woken from a suspended state. This combination of errors paints a grim picture: the Radeon GPU is not just misbehaving; it is fundamentally failing its internal checks, making it completely unusable for any graphical output. This would directly result in a frozen or black screen, bringing the entire desktop experience to a grinding halt. It’s like a critical engine component failing its pre-flight check, ensuring the entire ‘digital aircraft’ stays grounded. This level of failure suggests either a severe driver bug specific to this older hardware with newer software, or even a nascent hardware issue exacerbated by new demands.
Alright, so we’ve navigated the treacherous waters of graphical glitches and software missteps, uncovering how KWin, Baloo, and even Plasmashell itself can throw a digital wrench into your workflow. We even delved into the catastrophic failures of the Radeon GPU, a true nightmare for anyone relying on a smooth visual experience. But hold onto your keyboards, because our journey into the digital abyss isn’t over yet. The plot thickens, revealing that the troubles extend beyond the screen and into the very hardware and resource management of your system. Think of it as a multi-layered disaster, where the core infrastructure begins to crack under pressure.
This next leg of our investigation delves into what happens when the physical components and underlying operating system resources decide to call it quits. We’re talking about the foundational elements that keep your ‘digital fleet’ sailing smoothly – hard drives, USB devices, and even the crucial system services that orchestrate everything behind the scenes. Just like a real-world logistics chain, a failure in these areas can have cascading effects, turning minor annoyances into total system freezes. It’s time to shine a light on these less-obvious, but equally devastating, culprits, continuing our quest to understand how a robust Linux setup can turn into a frozen statue.
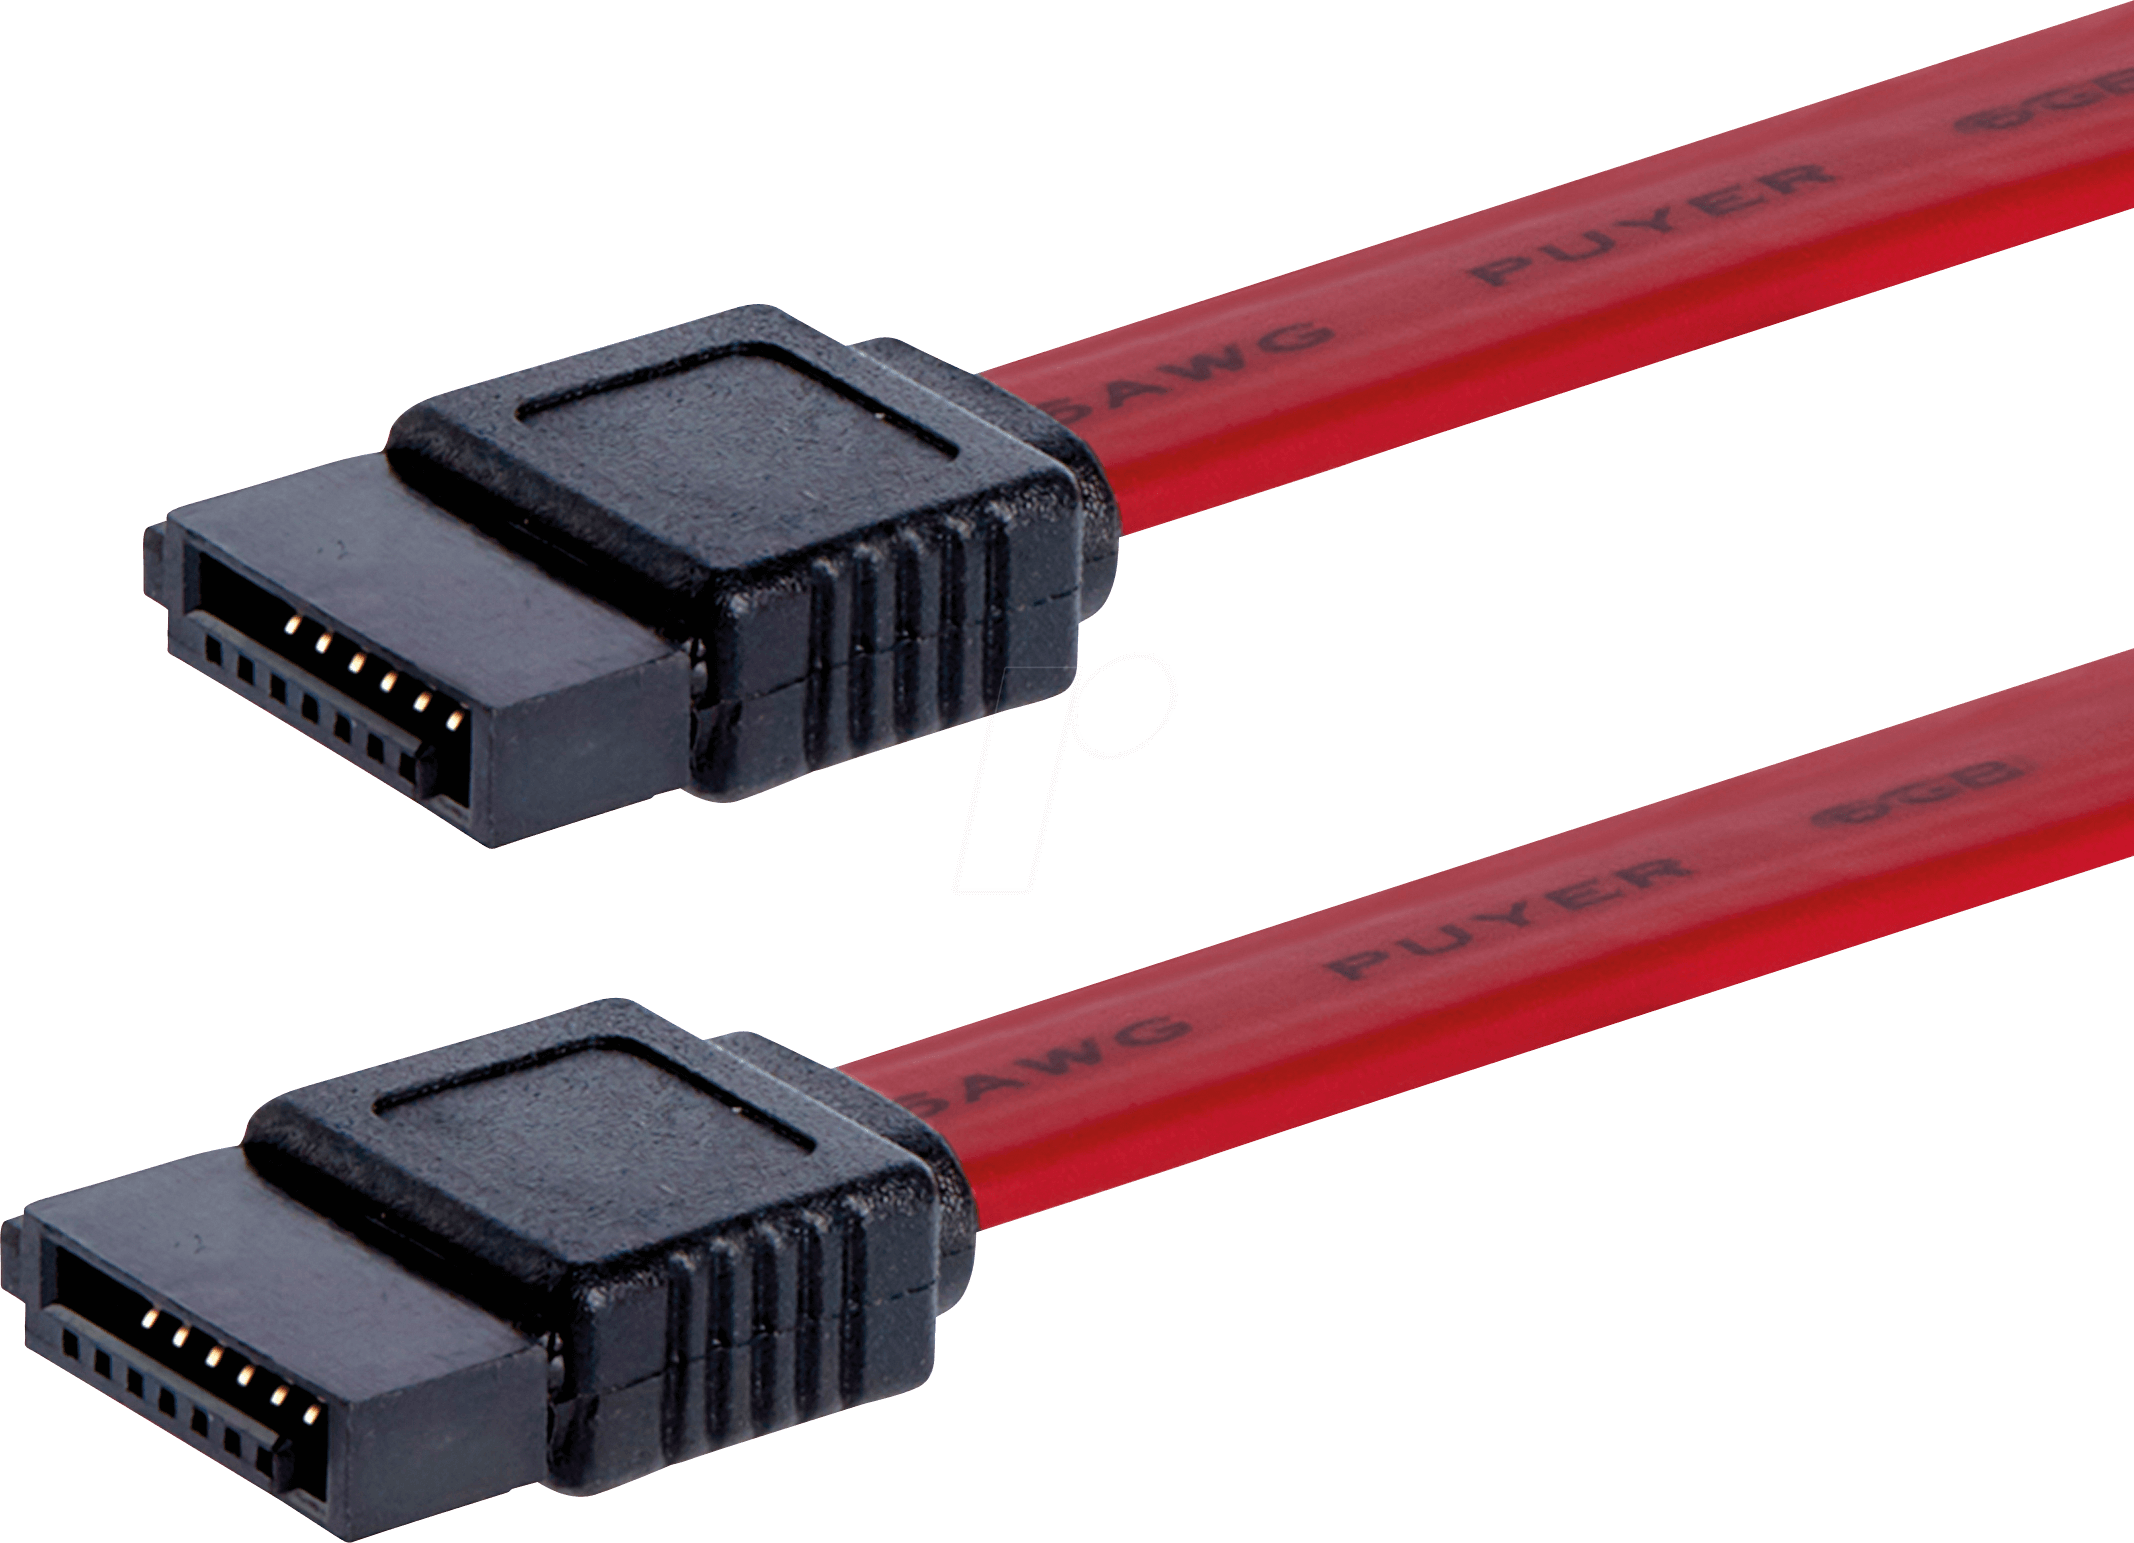
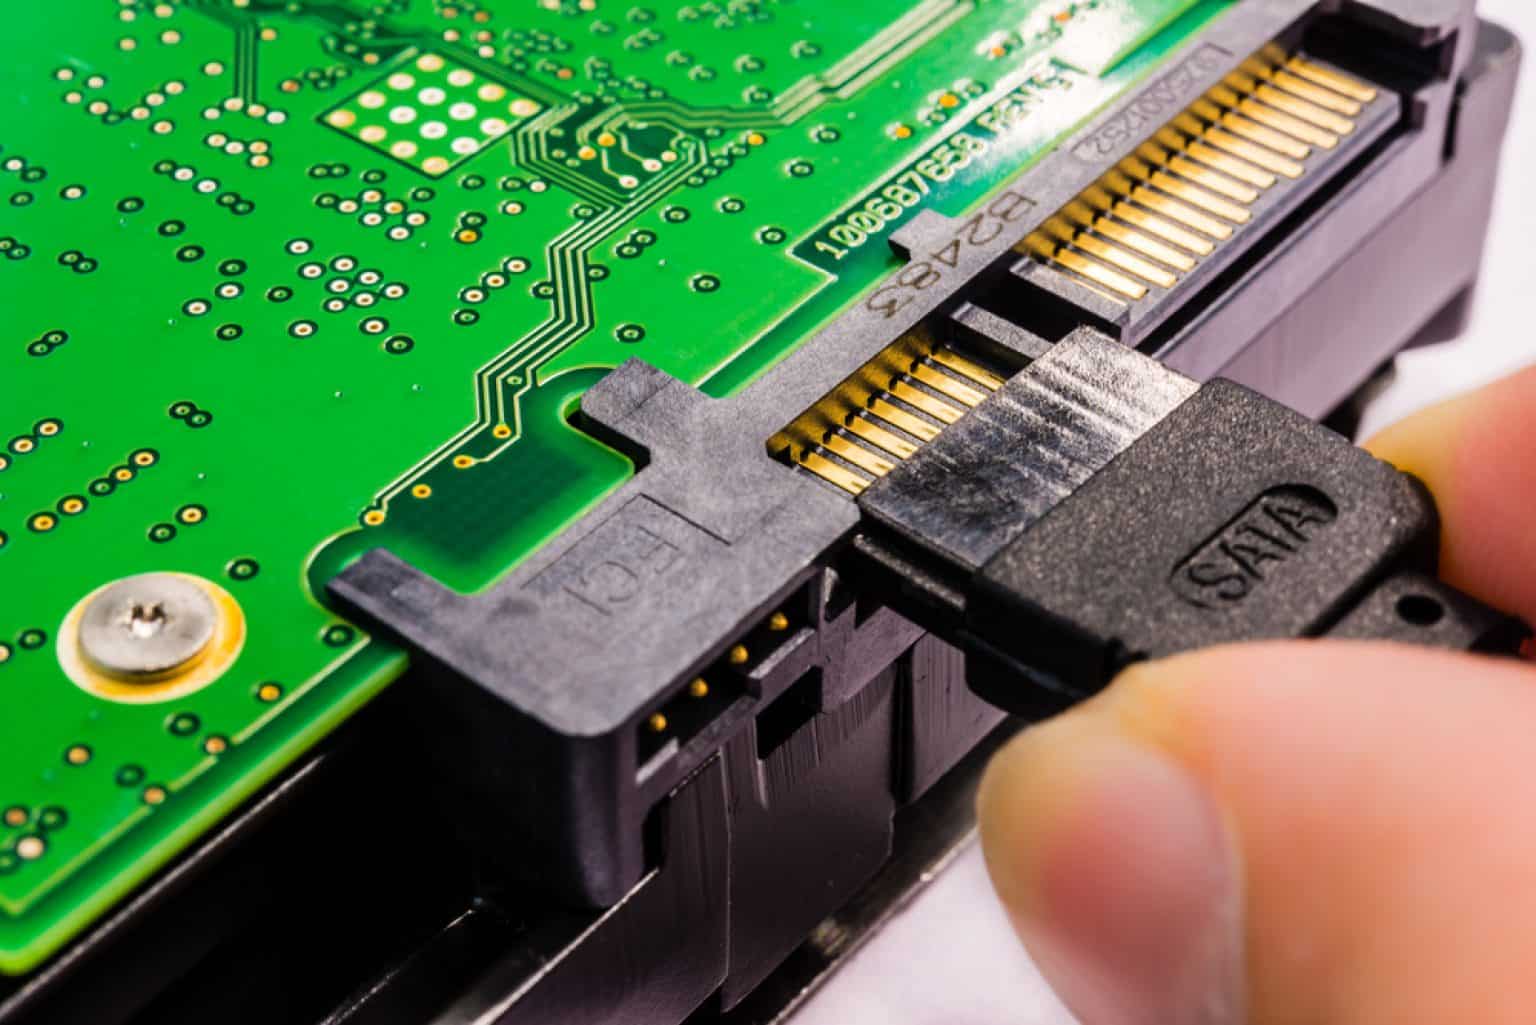
7. **SATA Interface Fatal Error (Type 1: UnrecovData, BadCRC)**Our deep dive into the `dmesg` logs reveals a truly alarming message: `ata2.00: exception Emask 0x50 SAct 0x6000000 SErr 0x2c0900 action 0x6 frozen`. This isn’t just a warning; it’s a declaration of a critical issue with the SATA interface connecting to one of your storage drives, specifically `ata2`. The `action 0x6 frozen` part is particularly chilling, indicating that the system’s attempt to recover from this error resulted in the interface becoming completely unresponsive. It’s like a critical port in your digital shipping network suddenly freezing up, halting all incoming and outgoing data traffic.
Delving deeper into this specific error, the `SError: { UnrecovData HostInt CommWake 10B8B BadCRC }` provides us with a clearer picture of the disaster. `UnrecovData` suggests that data was corrupted and couldn’t be recovered from the drive, a serious integrity issue. The `BadCRC` (Cyclic Redundancy Check) component further confirms this, indicating that data packets exchanged between the system and the drive failed their integrity checks. Imagine trying to read important documents, only to find them riddled with unreadable sections and checksum errors; it’s a recipe for chaos.
What’s more, the log also mentions `HostInt` (Host Initiated) and `CommWake` (Communication Wakeup), which could imply issues with the host controller or the drive’s ability to maintain a stable communication link. The repeated `failed command: READ FPDMA QUEUED` entries solidify the problem: the system is desperately trying to read data from `ata2`, but the commands are failing due to the underlying interface and data corruption issues. This level of storage subsystem failure isn’t just about losing a file; it can bring the entire operating system, which relies heavily on constant disk access, to a screeching halt.
8. **SATA Interface Fatal Error (Type 2: RecovData, UnrecovData, BadCRC)**As if one type of SATA interface fatal error wasn’t enough, our logs present another, slightly different, but equally concerning variant: `ata2.00: exception Emask 0x50 SAct 0x200000 SErr 0x2c0901 action 0x6 frozen`. While sharing the `frozen` action and the `Emask 0x50` (ATA bus error), the `SError` flags offer a nuanced perspective on this particular catastrophe: `{ RecovData UnrecovData HostInt CommWake 10B8B BadCRC }`. The inclusion of `RecovData` here is intriguing, suggesting that some data *could* be recovered, contrasting with the previous entry where recovery seemed impossible.
However, the presence of both `RecovData` and `UnrecovData` alongside `BadCRC` paints a confusing, yet still dire, picture. It implies a struggle, where the system is trying to piece together fragmented or corrupted data, with some success but ultimately facing unrecoverable segments. This could be indicative of intermittent issues with the SATA cable, the drive controller, or even a nascent problem within the drive itself. Such intermittent failures can be particularly insidious because they don’t immediately manifest as a total breakdown, but rather as persistent, system-slowing struggles.
This series of `ata2` errors, alongside the later log entry `ata2: limiting SATA link speed to 3.0 Gbps`, strongly suggests a chronic problem with the second storage device. The system, in a desperate attempt to stabilize communications, is throttling the transfer speed. While this might prevent immediate crashes, it signifies a compromised connection and drastically reduced performance, potentially leading to bottlenecks that could contribute to system unresponsiveness under heavy load. It’s like a damaged highway, where traffic is continuously slowed to a crawl, eventually causing massive jams.
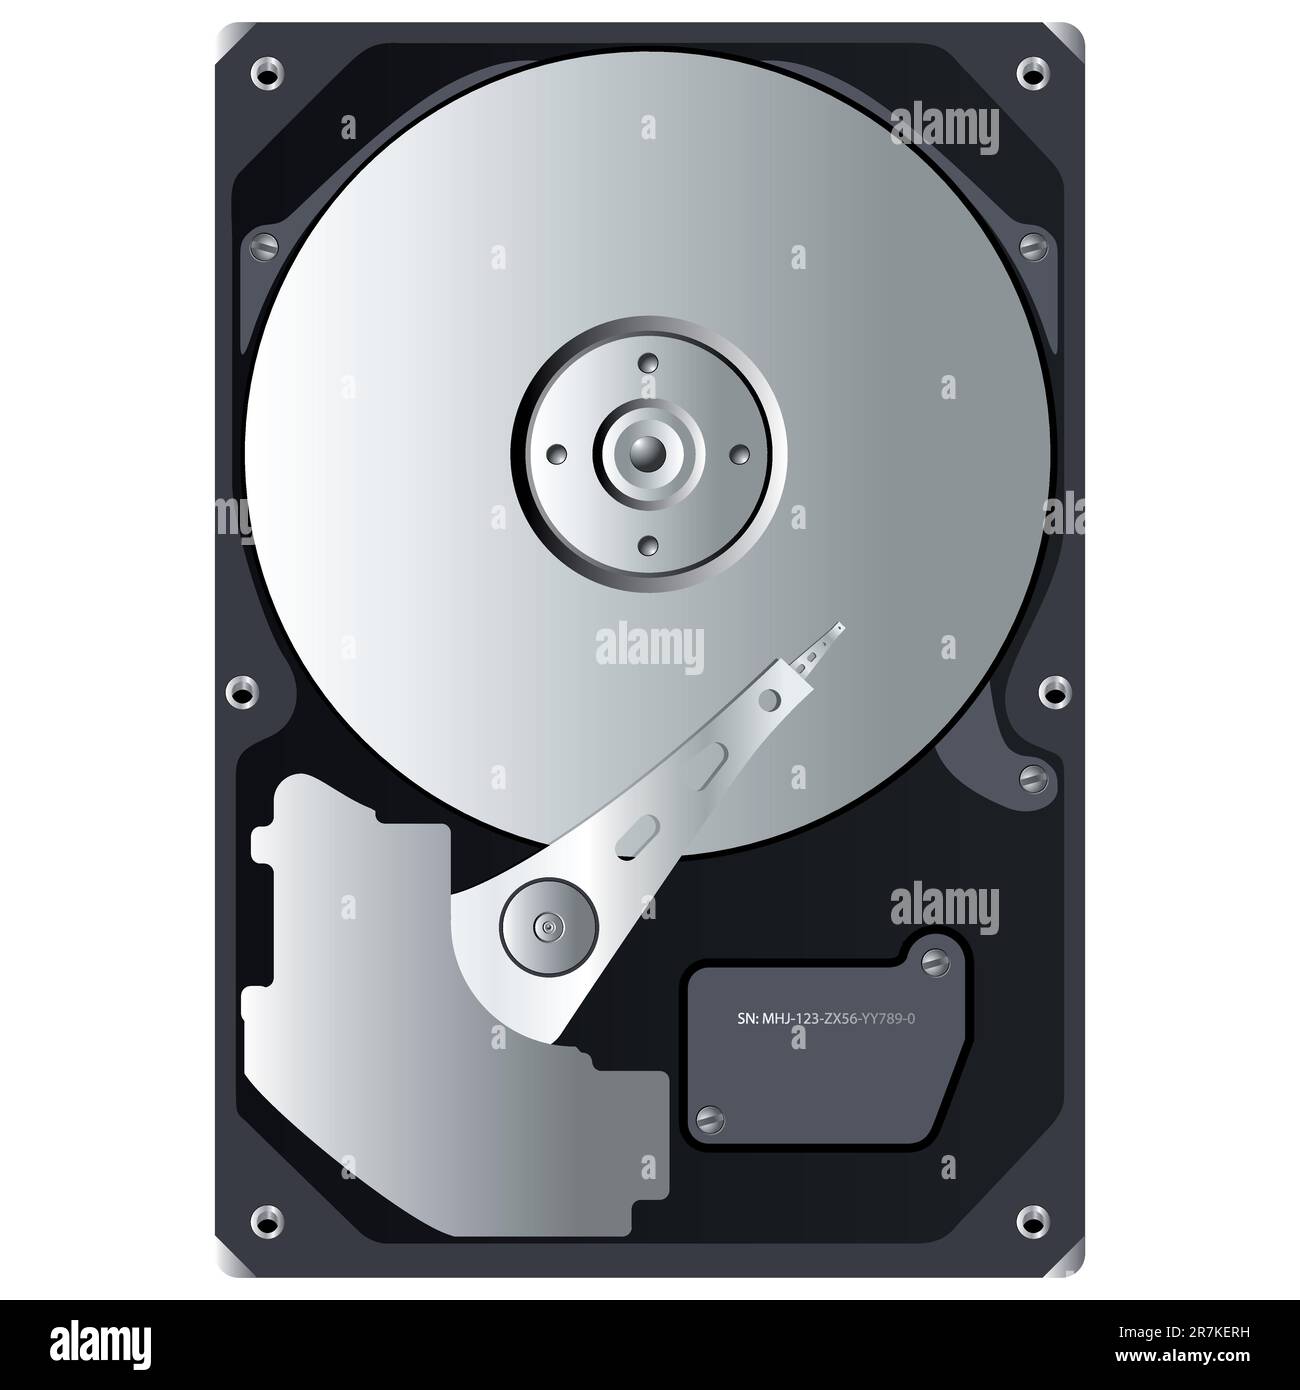
9. **Disk I/O Error on ‘sdb’**Directly tied to our storage woes, we find multiple entries of `I/O error, dev sdb, sector X op 0x0:(READ) flags 0x80700 phys_seg 1 prio class 2`. This is a straightforward, no-nonsense warning that your system is failing to read data from `/dev/sdb`, which, according to our `inxi` output, corresponds to the Western Digital WD10JPCX-24UE4T0 hard drive. An I/O error means exactly what it sounds like: the input/output operation, a fundamental task for any computer, has failed.
When your system can’t reliably read from a disk, especially one that might contain critical system files or user data, everything grinds to a halt. Imagine a library where every third book you pull out crumbles in your hands – eventually, you can’t find what you need to continue your research. These errors often point to bad sectors on the hard drive, indicating physical degradation of the storage medium. If these bad sectors reside in areas frequently accessed by the operating system or your applications, the impact on stability and performance will be severe.
The persistent nature of these I/O errors, cropping up at different sector numbers, solidifies the suspicion that the `/dev/sdb` drive is experiencing significant issues. Such problems can easily cause applications to freeze, data corruption, and ultimately, a system-wide unresponsiveness because core processes are left waiting indefinitely for data that never arrives. In the context of our multi-layered meltdown, a failing hard drive is a colossal blow, crippling the system’s ability to even maintain its own existence, let alone respond to user input.

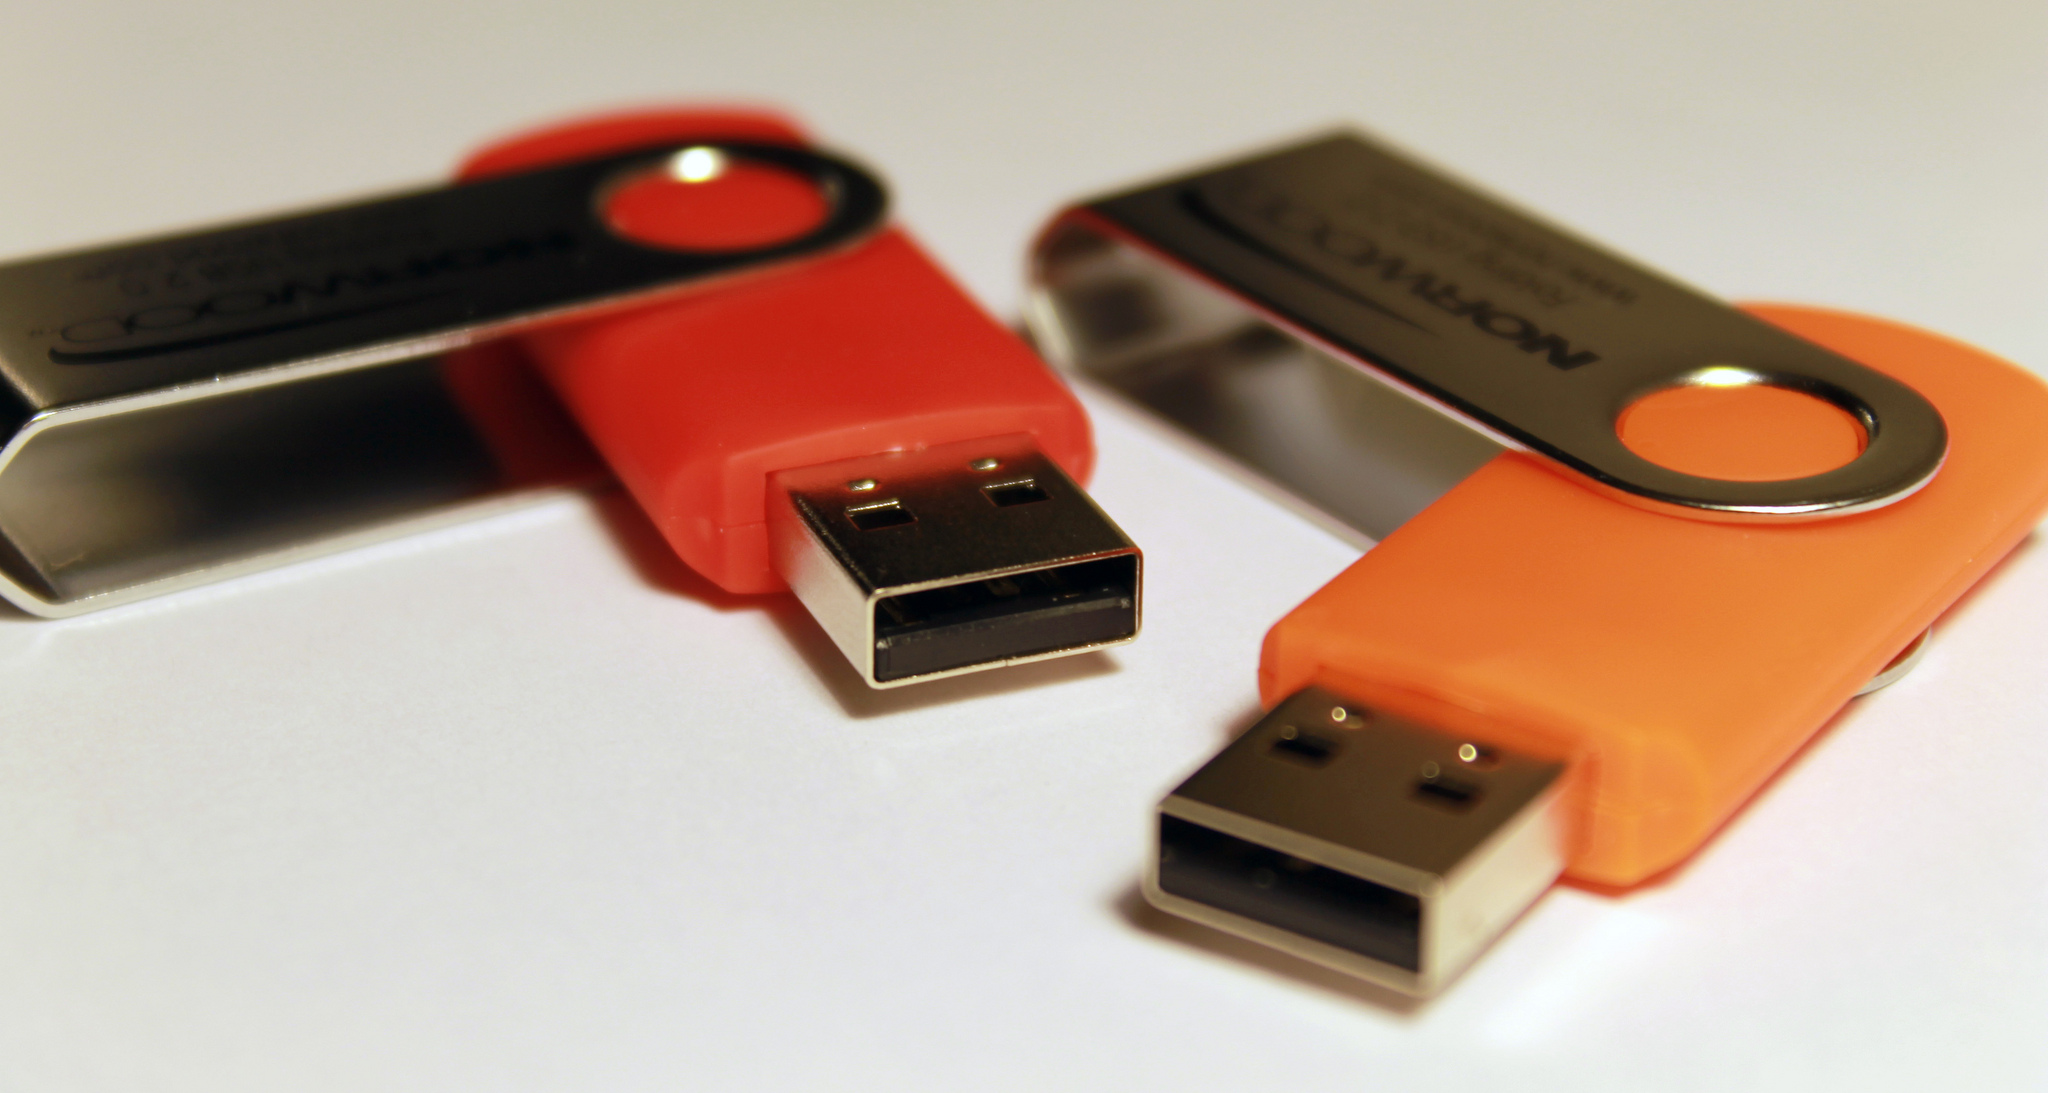
10. **USB UVC Control Failure (GET_INFO)**Stepping away from storage for a moment, let’s look at another external interaction that went sideways. The logs present `usb 2-6: Failed to query (GET_INFO) UVC control 8 on unit 1: -32 (exp. 1)`. This cryptic message specifically targets a USB device, identified as `usb 2-6`, which the `inxi` output reveals to be the “IMC Networks Lenovo EasyCamera” – your laptop’s integrated webcam. The `UVC` refers to the USB Video Class, the standard protocol for webcams and other video devices.
The `Failed to query (GET_INFO) UVC control 8` part indicates that the system tried to retrieve information about a specific control on the camera (control `8` on unit `1`), but the operation failed. This ‘control’ could be anything from brightness settings to resolution adjustments or even a basic status check. A failure to get this information suggests that the camera, or its communication pathway, is not behaving as expected. It’s like trying to ask a sensor for its reading, and it just returns static.
While a webcam failing might not seem as critical as a GPU or hard drive issue, these errors, especially if they are persistent, can consume system resources as the kernel repeatedly tries and fails to communicate. Furthermore, if applications or desktop components are designed to interact with the webcam (e.g., a media controller trying to check for active video input), these failures could contribute to system instability or cause freezes when the system tries to handle a non-responsive device. It’s another small, but significant, crack in the overall system’s stability.
11. **USB UVC Control Failure (GET_DEF)**Adding to the webcam woes, we see another distinct but related error: `usb 2-6: Failed to query (GET_DEF) UVC control 8 on unit 1: -32 (exp. 1)`. Similar to the `GET_INFO` failure, this error targets the same USB UVC device (your webcam) and control `8` on unit `1`. However, `GET_DEF` specifically refers to an attempt to retrieve the *default* value for that control. This suggests that the system isn’t just failing to get current status, but also struggling to even understand the baseline operational parameters of the device.
The distinction between `GET_INFO` and `GET_DEF` is important. If the system can’t get basic information *or* default settings, it implies a more fundamental communication breakdown with the camera. It’s not just a transient glitch; it’s a deep-seated inability to properly enumerate or initialize the device’s capabilities. These repeated failures, often appearing in close proximity within the logs, signal a persistent problem that the kernel cannot resolve on its own.
Such consistent USB device communication failures can lead to kernel-level delays, as the USB subsystem attempts retries and error handling, consuming CPU cycles that could otherwise be used for responsive system operations. In a fragile state like our frozen Manjaro system, even these seemingly minor peripheral issues can be the straw that breaks the camel’s back, contributing to overall system lockups when combined with the other critical failures we’ve observed. It’s like a minor peripheral system continuously pinging for an unresponsive component, distracting the central processing unit from more critical tasks.

12. **Systemd Inotify Watch Descriptor Exhaustion**Finally, let’s talk about a resource management nightmare that’s a true hidden villain in many Linux system freezes: `Failed to add control inotify watch descriptor for control group …: No space left on device`. This isn’t about disk space, or memory, or CPU, at least not directly. This is about `inotify` watch descriptors – a kernel resource used by `systemd` (and other programs) to monitor file system events, such as changes, accesses, or deletions. It’s how your system quickly reacts to things happening with files.
When `systemd` reports `No space left on device` for an `inotify` watch descriptor, it means the kernel has run out of available ‘slots’ to monitor file system events. Every time an application or service wants to be notified of changes to a file or directory, it requests an `inotify` watch. If too many applications, or poorly behaved ones, request an excessive number of watches, or if a global limit is too low, the system simply runs out. This particular log entry shows it happening for multiple applications and services (`Lollypop`, `vte-spawn`, `skypeforlinux`, `gvfs-daemon`, `gcr-ssh-agent`).
This resource exhaustion is a critical problem because many modern Linux desktop environments and applications rely heavily on `inotify` to remain responsive and efficient. Without the ability to monitor file system events, processes can miss crucial updates, fall out of sync, or simply fail to start correctly. Imagine a control tower running out of channels to communicate with incoming aircraft; chaos ensues. The system becomes blind to changes, leading to unresponsive applications, broken desktop functionality, and eventually, a full system freeze as vital services can no longer operate. It’s a silent killer, slowly choking the system’s ability to react to its own environment.
After painstakingly piecing together this mosaic of system logs, a clearer, albeit troubling, picture emerges. It’s not just one catastrophic failure that plunges this Manjaro Linux system into unresponsiveness; it’s a perfect storm of cascading issues. From the graphical glitches that mangle your display to the file indexing woes that slow you down, the GPU’s complete meltdown, the core storage system’s struggle for survival, the non-responsive webcam, and finally, the exhaustion of vital kernel resources, this digital fleet faced multiple, concurrent accidents. Each error, on its own, might be manageable, but their combined force creates an environment where a system upgrade, meant to enhance, instead becomes a perilous journey into the frozen unknown. This investigation serves as a stark reminder of the intricate dance between hardware, kernel, and user space, and how a single misstep, or several, can halt even the most robust digital companion in its tracks.


