

Have you ever found yourself making snap judgments about another driver based purely on the badge on their car? Most of us have, whether we admit it or not. The ubiquitous Nissan Altima often conjures images of aggressive maneuvers, while a pristine Jeep Wrangler might be jokingly dubbed a ‘mall crawler.’ These aren’t just idle observations; they are often deeply ingrained stereotypes, yet the reality, backed by solid data, can be far more surprising and complex than simple assumptions. The road is a shared space, and understanding the patterns of driver behavior, especially those linked to specific vehicles, is not just fascinating, but crucial for safety and even your wallet.
In an age where data reigns supreme, several compelling U.S. studies have delved into the intricacies of driver behavior, moving beyond anecdotal evidence to compile hard facts from the insurance industry and traffic incident reports. LendingTree, a specialist in auto loans and insurance, conducted a comprehensive analysis of 30 car brands based on insurance inquiries from January to December 2024. Their findings shed light on which vehicles are most frequently associated with accidents, DUIs, speeding violations, and various other citations. This isn’t just about assigning blame; it’s about identifying trends and understanding where the most significant risks lie.
Adding further layers to this crucial conversation, other significant investigations like those by iSeeCars.com and the U.S. Insurance Institute for Highway Safety (IIHS) with MIT’s AgeLab have explored fatal accident rates and the impact of semi-autonomous driving systems. These studies collectively paint a detailed picture of the driving landscape in America, challenging preconceived notions and providing a factual basis for discussions around road safety. As senior media editors, our job is to bring you these insights, not just as abstract statistics, but as actionable knowledge that impacts every driver. So, let’s peel back the layers and explore which cars, according to the latest data, are most frequently driven by those with the ‘worst-behaved’ profiles on our roads.
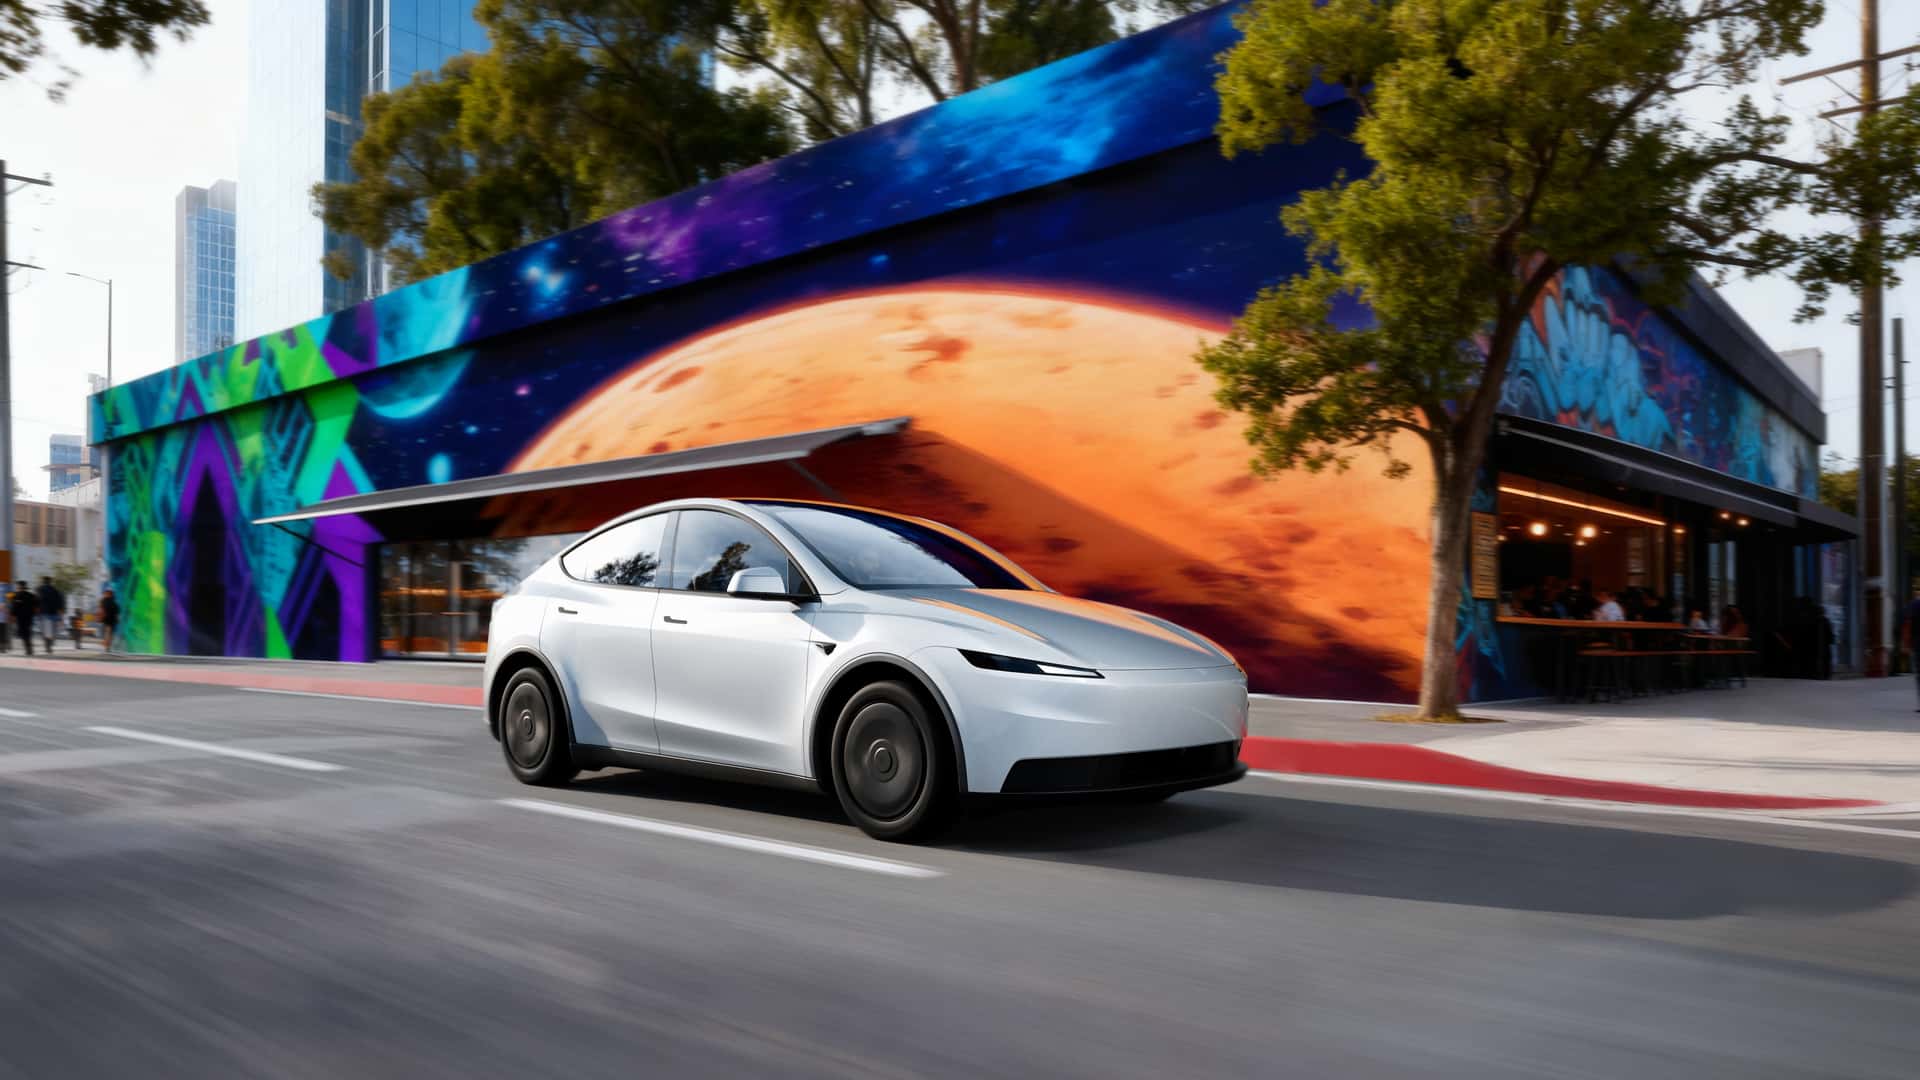
1. **Tesla: Leading the Charge in Incidents and Fatal Accidents**When we talk about vehicles linked to the worst-behaved driver profiles, one brand consistently appears at the very top of recent studies: Tesla. According to LendingTree’s extensive 2024 analysis, Tesla drivers recorded an astounding 36.94 reported incidents per 1,000 drivers. This figure marks a significant 16 percent increase from the previous year, propelling Tesla past Ram to claim the unenviable top spot. These incidents encompass a wide range of infractions, including accidents, DUIs, speeding violations, and various citations, highlighting a broad pattern of problematic driving behavior associated with the brand.
Beyond just general incidents, Tesla also faces scrutiny regarding its fatal accident rates. An iSeeCars.com study published in November, which is based on crash data, revealed that Tesla has the highest fatal accident rate of all car brands, registering 5.6 fatal accidents per billion vehicle miles. This rate is alarmingly high and reflects that, despite the advanced technology, the behavior of drivers behind the wheel remains a critical factor. The combination of high incident rates and high fatal accident rates presents a serious concern for road safety advocates and potential Tesla owners alike.
A significant part of the issue, as highlighted in the context, stems from Tesla’s Autopilot system and its “Full Self-Driving” capability. While these technologies are designed to assist, they are far from flawless and can be misleading. This often prompts drivers to over-rely on the system and divert their attention from the road, leading to a dangerous complacency. The unfortunate consequence is that many multiple accidents resulting from these actions have led to casualties. Perhaps even more concerning is the reported stance of Tesla CEO Elon Musk, who, instead of focusing on fixing these critical safety issues, is said to be calling for the U.S. National Highway Traffic Safety Administration (NHTSA) to drop crash reporting requirements for automated systems. This reported stance, as the original article states, begs the question, ‘Go figure.’
Further reinforcing these concerns, an investigation by the U.S. Insurance Institute for Highway Safety (IIHS) and the Massachusetts Institute of Technology’s AgeLab revealed that drivers are more prone to multitasking when utilizing semi-autonomous driving systems. Even when seemingly adhering to the systems’ attention requirements, drivers find ways to engage in other activities. A 2020 Tesla Model 3 with Autopilot was specifically included in these tests, underscoring the brand’s relevance in this critical area of study. While Tesla drivers lead nationally in incidents, there is a small silver lining, as the number of states where Tesla is ranked the worst has reportedly decreased, showing some potential, albeit slow, improvement in driver behavior in certain regions.
Read more about: NHTSA Intensifies Scrutiny of Tesla: Unpacking Safety Concerns from Faulty Door Handles to Advanced Driver-Assistance Systems

2. **Ram: The Truck That Leads in State-Level Incidents**While Tesla might hold the national top spot for overall incidents, the Ram brand has firmly established itself as a close second, with 33.92 incidents per 1,000 drivers, according to LendingTree’s 2024 study. This places Ram just behind Tesla, having been knocked off its previous year’s perch. The perception of Ram drivers often includes stereotypes of aggression, and the data, unfortunately, lends some credence to these popular beliefs. These trucks, known for their powerful presence on the road, are frequently associated with various types of driving infractions.
What truly sets Ram apart in this unfortunate ranking is its dominance at the state level. LendingTree’s analysis indicates that Ram drivers are identified as the worst in an impressive 16 different states across the U.S. This widespread pattern of high-incident driving in numerous regions paints a clear picture of a brand consistently associated with risky behavior. While this number is a slight improvement from last year, when Ram drivers were the worst in 23 states, it still highlights a significant challenge for road safety in many parts of the country.
The data becomes even more stark when looking at specific localities. For instance, in New Jersey, Ram drivers exhibit a staggering 74.20 incidents per 1,000 drivers. This figure is described as “by far the highest of any vehicle in the state,” underscoring a particularly concentrated problem area for Ram drivers. Such high incident rates translate directly into increased risks on the road for everyone, and, as the experts note, higher insurance premiums for Ram owners. The sheer volume of incidents linked to Ram drivers across numerous states makes it a consistently featured brand among those with the least desirable driver profiles.
Beyond the raw numbers, the connection between certain vehicle types and driver behavior is an ongoing topic of discussion. While a vehicle doesn’t inherently ‘make’ a person drive a certain way, the characteristics of a truck like the Ram — often associated with power and utility — might, for some, contribute to a specific driving persona. Regardless of the underlying psychology, the data firmly places Ram as a brand whose drivers, collectively, demonstrate a propensity for incidents, demanding extra vigilance from other motorists when sharing the road with them.
Car Model Information: 2018 RAM 1500 SLT
Name: Ram Trucks
Logo: Ramchryslerlogo.png
FormerName: Dodge Ram
Type: division (business)
LocationCity: Auburn Hills, Michigan
Foundation: [object Object]
AreaServed: North America, Middle East, Latin America, Europe, Southeast Asia, Oceania, and Angola
Industry: Automobile
Predecessor: Graham Brothers,Fargo Trucks,Plymouth (automobile)#Plymouth trucks
KeyPeople: Tim Kuniskis (CEO)
Products: Truck
Parent: Chrysler
Homepage: https://www.ramtrucks.com/|ramtrucks.com
Categories: 2010 establishments in Michigan, All Wikipedia articles written in American English, All articles with unsourced statements, Articles with short description, Articles with unsourced statements from July 2024
Summary: Ram Trucks (stylized as RAM) is an American brand of light to mid-weight pickup heavy duty trucks and other commercial vehicles, and a division of Stellantis North America (previously Chrysler Group LLC). It was established in a spin-off of Dodge in 2009 using the name of the Ram pickup line of trucks. Ram Trucks’ logo was originally used as Dodge’s logo. New series Ram 1500 pickups are made at Sterling Heights Assembly in Sterling Heights, Michigan. Since its inception, the brand has used the slogan “Guts. Glory. Ram.”
Get more information about: Ram Trucks
Buying a high-performing used car >>>
Brand: Ram Model: Truck
Price: $22,000 Mileage: 62,720 mi.
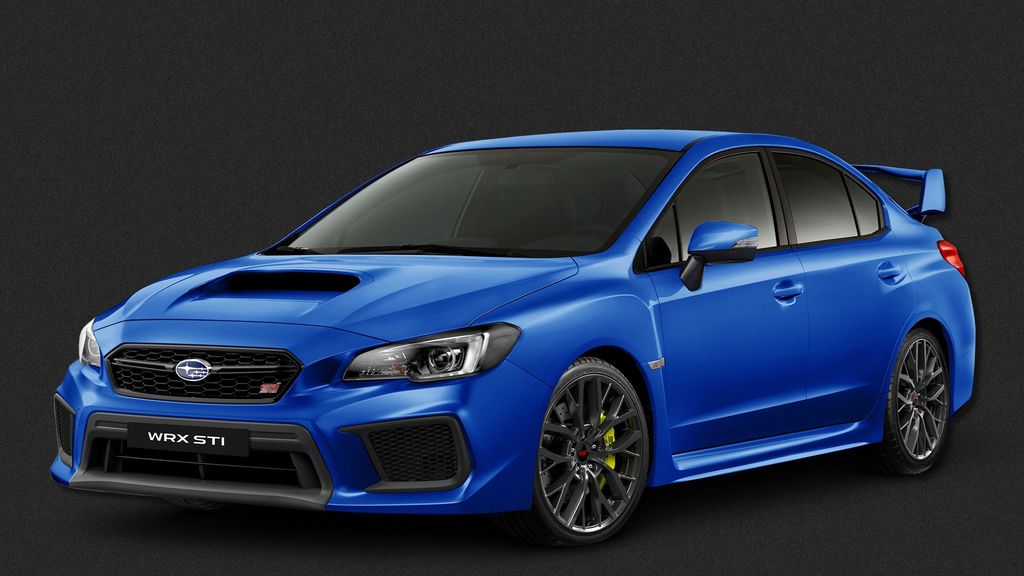
3. **Subaru: The Surprising ‘Speed Demon’ on the List**Rounding out the top three for worst-behaved driver profiles, we find a somewhat surprising entrant: Subaru. With 32.85 incidents per 1,000 drivers, Subaru’s placement on LendingTree’s list might raise an eyebrow for some, as the brand is often associated with safety and outdoor adventures. However, the data tells a different story, suggesting that a significant segment of Subaru drivers exhibit behaviors that lead to a higher incident rate. This inclusion underscores that no brand is entirely immune to the patterns of problematic driving, and stereotypes can sometimes be misleading.
The context explicitly notes that “Some Subaru models can be real speed demons.” This points to specific models within the Subaru lineup, such as the WRX, which are popular among racing enthusiasts. It’s common for owners of these performance-oriented vehicles to customize them with “all the racing mods,” and, consequently, to test their limits on public roads. This pursuit of performance, unfortunately, can negatively affect the brand’s overall safety statistics, pushing its incident rates higher than one might initially expect for a marque known for its all-wheel-drive reliability and family-friendly appeal.
The high incident rate for Subaru, particularly when linked to speeding and potential modifications for racing, serves as a crucial reminder that driver behavior plays a paramount role, often eclipsing vehicle design or technology. As the LendingTree study, solely based on generalized insurance inquiry data, implies, these incidents are reflective of actions taken by drivers. Therefore, while Subaru manufactures capable and often safe vehicles, the choices made by a significant portion of its drivers contribute to its presence among the top brands with the most accident-prone individuals behind the wheel. It’s a call for all drivers, regardless of their vehicle’s reputation, to exercise caution and adhere to traffic laws.
Read more about: Beyond Anecdote: The Top 10 Car Brands Statistically Linked to Poor Driver Reputations on the Road
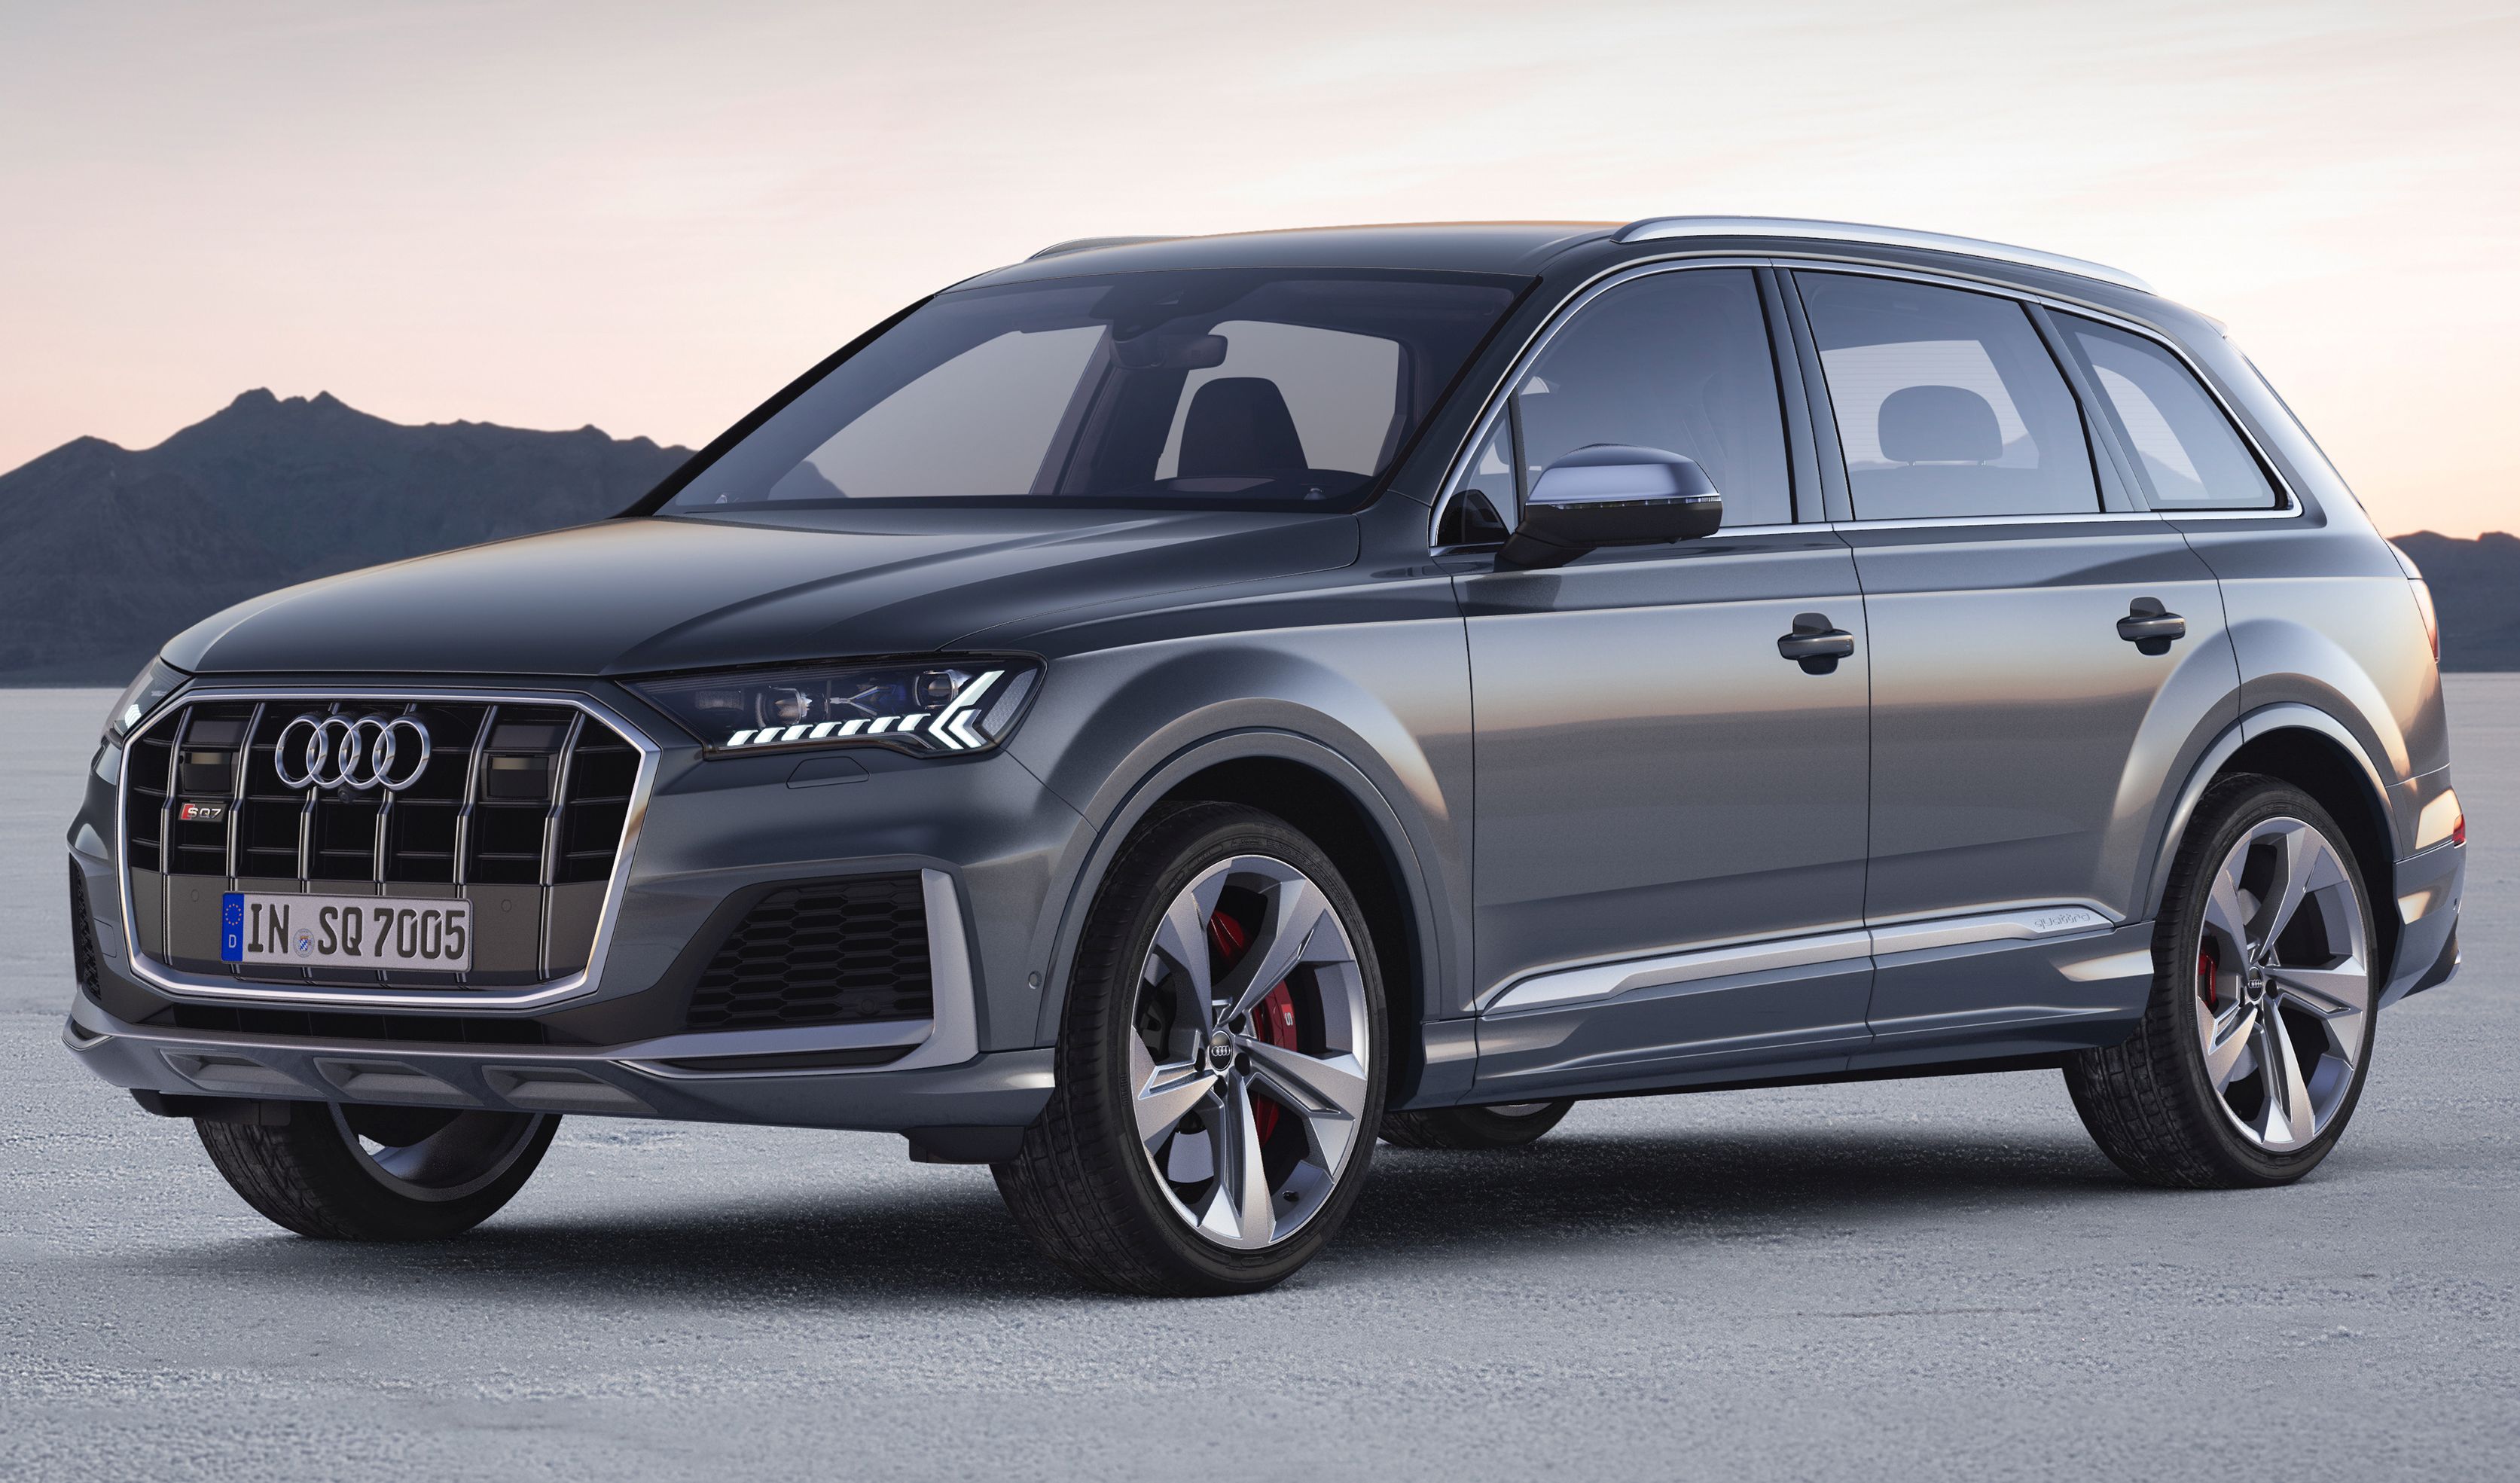
4. **Audi: The Luxury Newcomer with Concerning Incident Rates**Making its debut on the list of cars associated with high-incident drivers for 2024 is Audi, a brand synonymous with luxury, performance, and sophisticated engineering. With a rate of 32.23 incidents for every 1,000 drivers, Audi’s entry into this unenviable ranking is a notable development. This statistic positions Audi very close to Subaru in terms of overall incident frequency, suggesting that even drivers of premium vehicles are not exempt from the patterns of risky behavior that contribute to accidents, speeding tickets, DUIs, and other citations.
The inclusion of Audi on this list serves as a reminder that the price point or perceived prestige of a vehicle does not necessarily correlate with safer driving habits. While Audi cars are celebrated for their advanced technology and dynamic driving experience, it appears that the temptation to push those capabilities, or perhaps a general disregard for traffic regulations, affects a considerable number of its drivers. This data, drawn from LendingTree’s comprehensive insurance inquiry analysis, offers a factual counterpoint to any assumptions that luxury car owners might inherently be more cautious or responsible on the road.
For consumers, this information is particularly salient, as it underscores how driver behavior linked to specific brands can influence broader perceptions and practical considerations like insurance premiums. The fact that a luxury brand like Audi is now registering such a high incident rate means that insurers are taking note, and this collective behavior can lead to higher costs for all drivers associated with the brand. It highlights a critical aspect of road safety—that while vehicle design and features are important, the human element, and the choices made by drivers, remain the most significant variable in determining road safety outcomes. Drivers of Audis, like those of any other brand, bear the responsibility to ensure their driving reflects safety and respect for shared roadways.
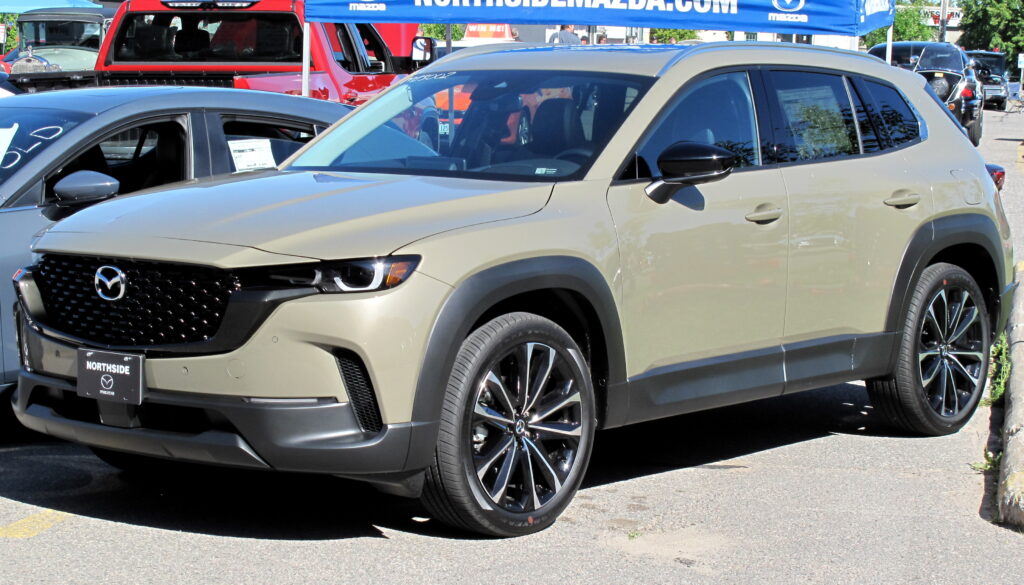
5. **Mazda: High Incident and Fourth-Highest Accident Rate**Coming in with a significant 31.86 incident rate per 1,000 drivers, Mazda finds itself firmly positioned on the list of brands with worst-behaved driver profiles. While Mazda vehicles are often praised for their engaging driving dynamics and reliability, the data from LendingTree’s analysis points to a distinct pattern of incidents among its drivers. This statistic is not merely an isolated number; it reflects a cumulative count of accidents, DUIs, speeding infractions, and other citations, all contributing to a less-than-stellar safety record associated with the brand.
Even more concerning is the additional finding that Mazda drivers are linked to the fourth-highest accident rate among all brands studied. This particular metric is a critical indicator of direct involvement in collisions, suggesting that Mazda drivers are not just receiving minor citations but are frequently implicated in actual crashes. Such a high accident rate has significant implications for overall road safety, as accidents can lead to injuries, property damage, and increased risks for all road users. It also directly impacts insurance premiums, as a higher likelihood of claims translates into higher costs for drivers of these vehicles.
This data serves as a compelling reminder that while car manufacturers design vehicles with safety features and performance in mind, the ultimate responsibility for safe driving rests with the individual behind the wheel. The characteristics that make Mazdas enjoyable to drive – such as their responsiveness and agility – might, in some cases, encourage more aggressive or less cautious driving habits among a segment of their owners. Regardless of the underlying reasons, the numbers clearly indicate that Mazda drivers, as a collective, are contributing to a higher frequency of incidents and accidents on American roads.
Read more about: Beyond Anecdote: The Top 10 Car Brands Statistically Linked to Poor Driver Reputations on the Road
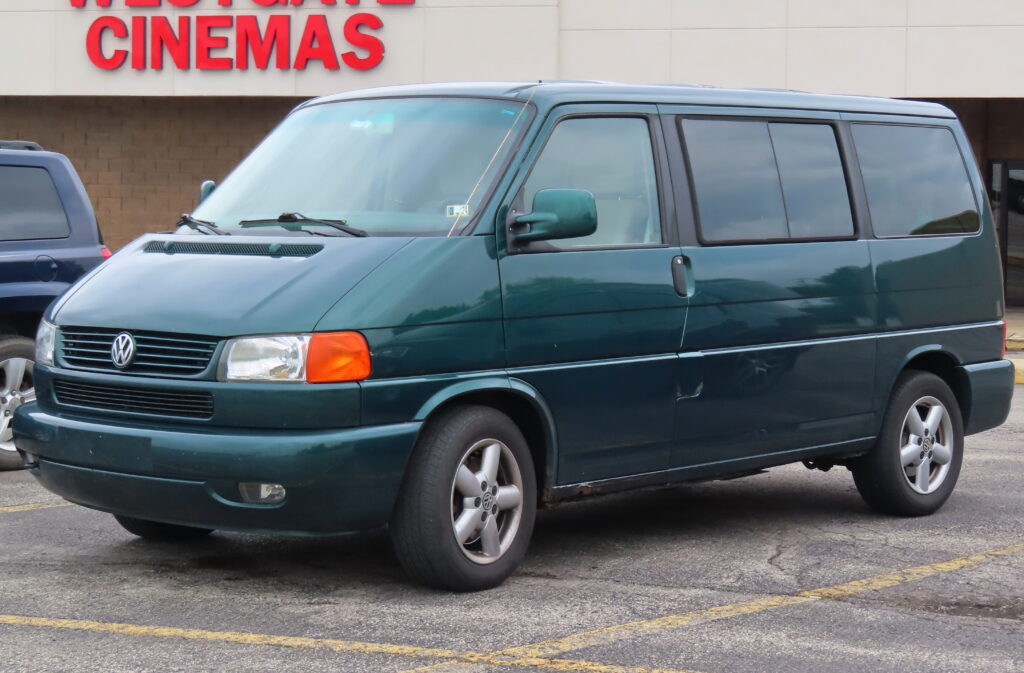
6. **Volkswagen: Geographic Hotspots for High Incidents**Volkswagen, a brand with a broad appeal and a reputation for solid engineering and practical vehicles, also features prominently on the list of brands associated with high-incident drivers. The LendingTree study reports a rate of 31.56 incidents per 1,000 Volkswagen drivers, placing it squarely within the top tier of vehicles with problematic driver profiles. This metric covers a range of driving infractions, from speeding and DUIs to various types of accidents and other citations, indicating a consistent pattern of risky behavior.
What makes Volkswagen’s entry particularly interesting is the geographical variance in its incident rates. The context highlights that these numbers are “much higher in some states, like Alaska and Idaho.” This suggests that while Volkswagen drivers may, on average, exhibit a certain level of problematic behavior nationally, there are specific regions where this behavior is significantly amplified. This could be due to a combination of factors, including local driving cultures, specific demographics of Volkswagen owners in those states, or unique road conditions that contribute to higher incident rates.
This regional disparity underscores the complex interplay between driver behavior, vehicle characteristics, and environmental factors. For insurers and road safety officials, understanding these geographic hotspots can be crucial for targeted interventions and policy adjustments. For the average driver, it serves as a reminder that local conditions and prevailing driving habits can dramatically influence the overall safety of the roads, even for a brand generally perceived as reliable and unassuming. The data compels us to look beyond national averages and consider the nuances of driving behavior across different locales.
Read more about: Beyond Anecdote: The Top 10 Car Brands Statistically Linked to Poor Driver Reputations on the Road
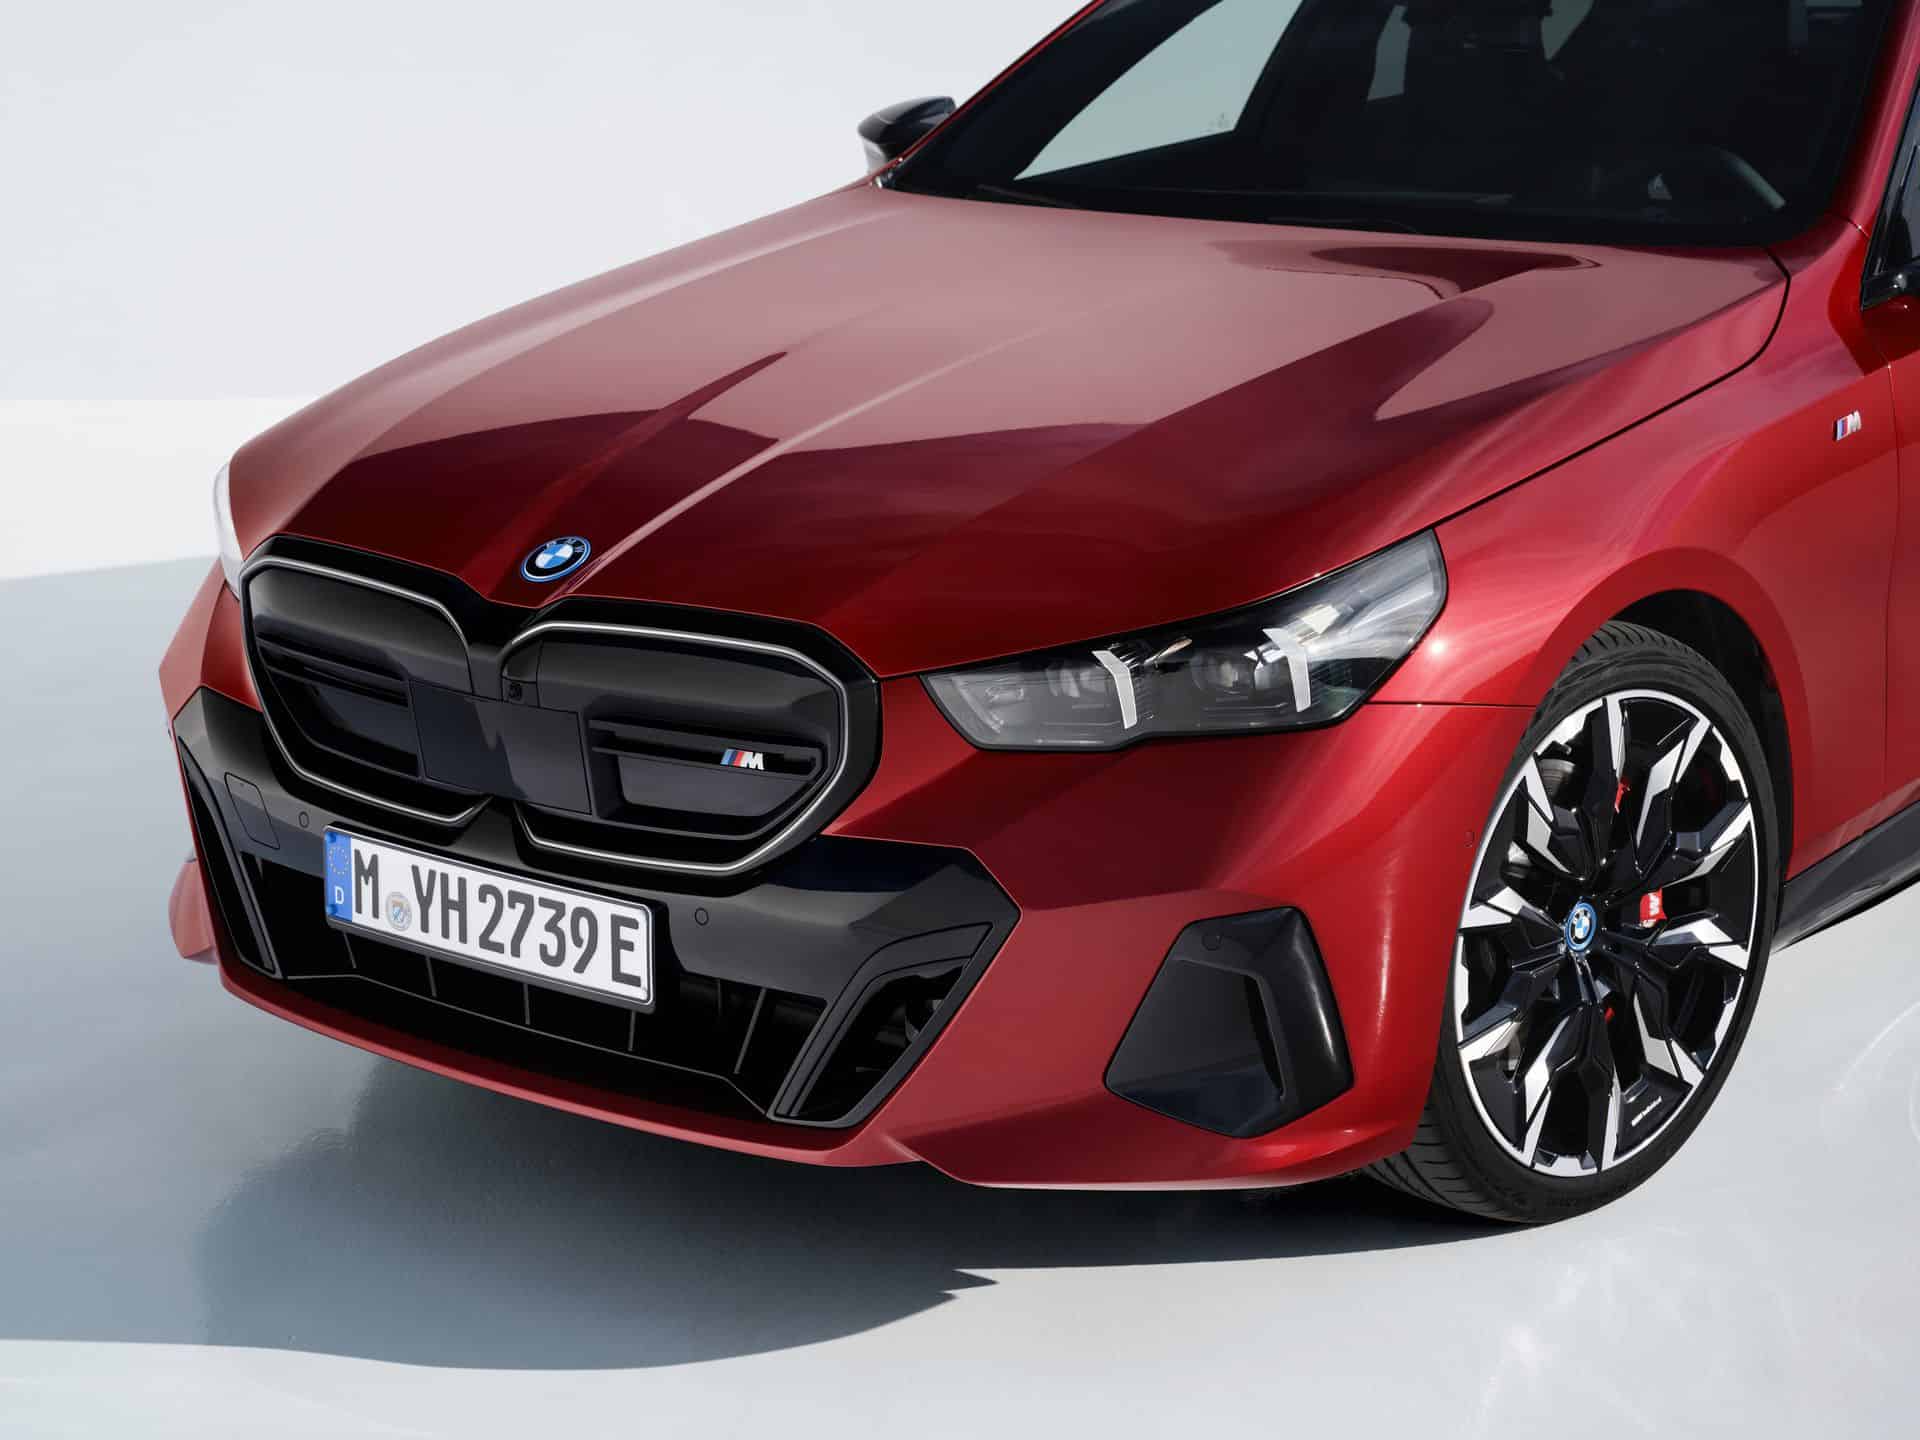
7. **BMW: A Luxury Brand with Improving, Yet Still Concerning, DUI Rates**BMW, another luxury brand often associated with performance and a discerning clientele, lands at seventh place on LendingTree’s list, with 26.82 incidents per 1,000 drivers. While this rate is lower than some of the brands higher up the list, it still firmly places BMW within the top tier of vehicles linked to high-incident driver profiles. For many, the perception of BMW drivers often includes stereotypes of aggressive or entitled behavior, and while data should always be the guide, these numbers indicate a persistent pattern of infractions among a segment of its owners.
One area where BMW has historically struggled, and continues to be a point of concern, is related to driving under the influence (DUIs). The context explicitly notes that BMW “did improve on their DUI rates in 2024, down to 2.57 from 3.13 in 2023.” While this improvement is a positive development, it’s important to remember that BMW had previously “earned that unenviable distinction last year” of having the highest DUI rate before Pontiac took the top spot in the latest analysis. This historical context highlights a sustained challenge for the brand regarding impaired driving.
Despite the recent improvement, BMW still features prominently in DUI statistics, ranking second for drivers with the most DUIs, trailing only Pontiac. This indicates that while the rate has decreased, a significant portion of BMW drivers continue to be involved in alcohol-related incidents. This is a critical safety issue, as impaired driving is a major contributor to fatal crashes and serious injuries. The data strongly suggests that the allure of a high-performance luxury vehicle, for some drivers, is unfortunately coupled with risky decision-making, especially concerning alcohol consumption before getting behind the wheel. All drivers, regardless of the badge on their car, have a shared responsibility to drive sober and safely.” , “_words_section1”: “1940
Continuing our exploration into the complex relationship between car brands and driver behavior, we now turn our attention to additional vehicles that, according to recent data, exhibit concerning trends. These insights are not just about assigning blame; they’re about understanding the nuanced patterns that affect road safety and, ultimately, your wallet through insurance premiums. Our analysis extends beyond general incident rates to scrutinize specific metrics such as DUI prevalence and fatal accident statistics, offering a more complete picture of the landscape of ‘worst-behaved’ driver profiles on America’s roads.
Read more about: Beyond Anecdote: The Top 10 Car Brands Statistically Linked to Poor Driver Reputations on the Road
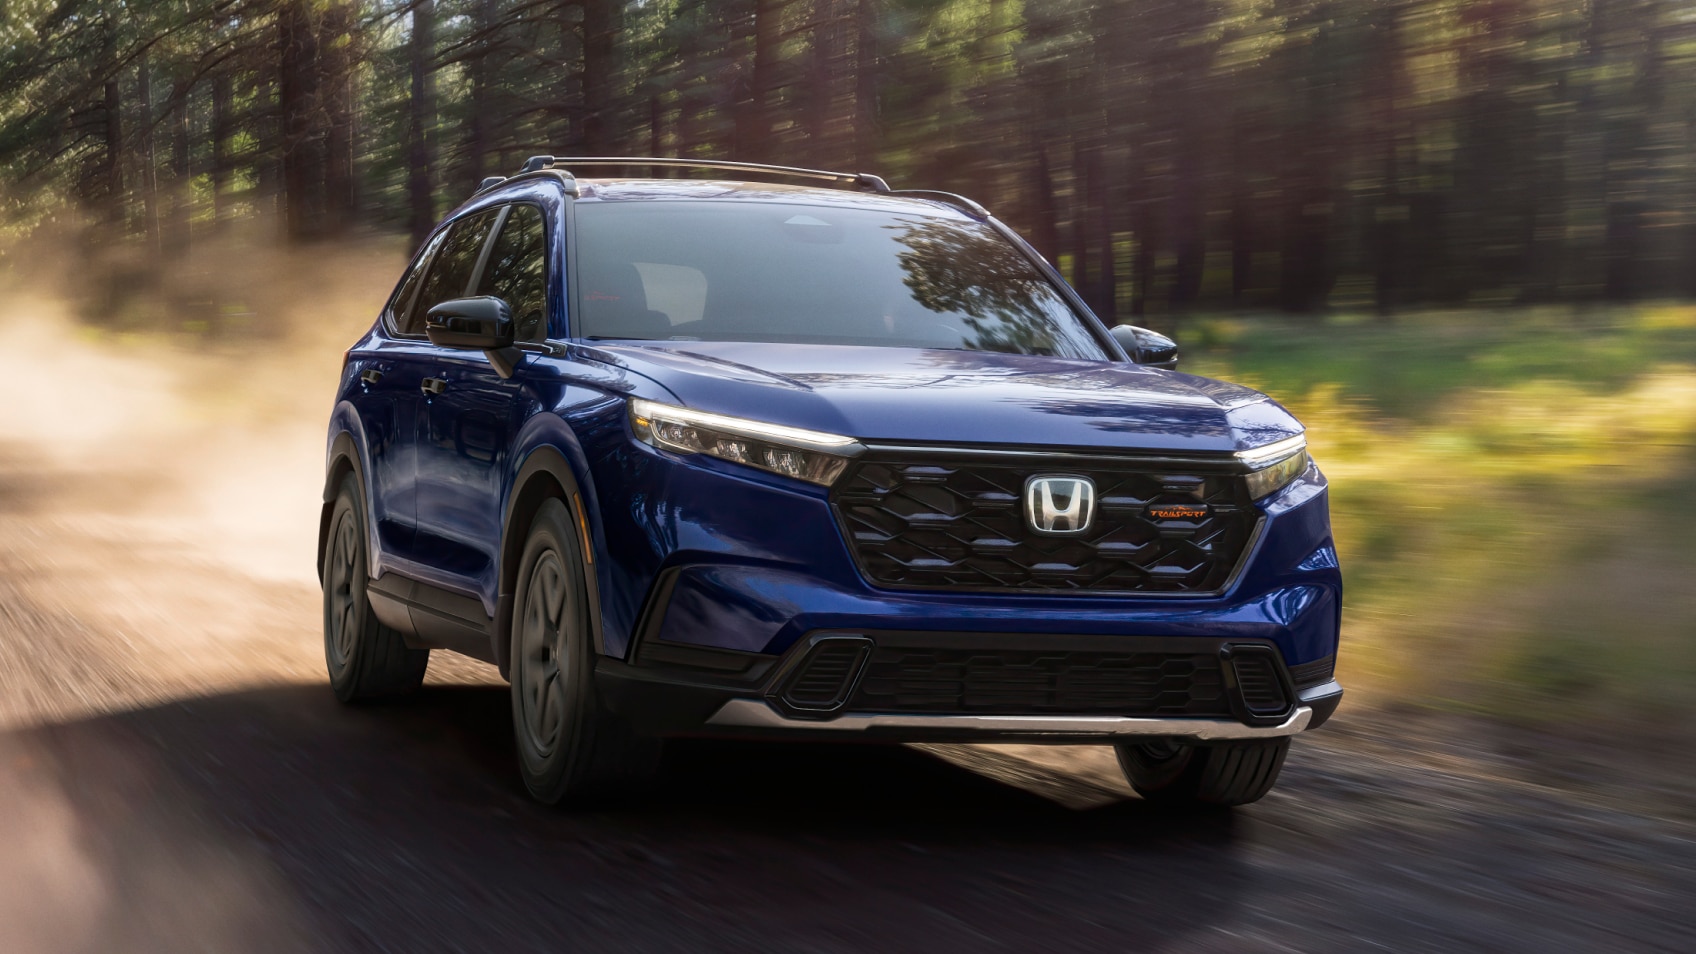
8. **Honda: A Ubiquitous Brand with Unexpected Incident Hotspots**Honda, a brand globally recognized for its reliability, fuel efficiency, and widespread appeal, makes a notable entry onto the list of vehicles associated with higher incident rates in 2024. According to LendingTree’s comprehensive study, Honda drivers logged an incident rate of 29.89 per 1,000 drivers. This figure places Honda squarely within the upper tier of brands whose drivers exhibit a propensity for various infractions, including accidents, speeding, and other citations.
What makes Honda’s inclusion particularly intriguing is the stark geographical disparity in its incident rates. The data reveals that in specific regions, such as the District of Columbia, Honda drivers exhibit an astonishingly high incident rate of 75.8 per 1,000 drivers. This is not just a national average; it’s a concentrated problem area that underscores how local driving conditions, demographics, and even regional stereotypes – like the popular notion of ‘Honda Civic people acting like the highway is the Corkscrew at Laguna Seca’ – can manifest in real-world data.
This regional variance suggests that while Honda vehicles themselves are engineered for safety and practicality, the collective behavior of drivers in certain areas significantly impacts the brand’s overall incident profile. For insurance providers, such localized hotspots are critical, as they directly influence risk assessments and, consequently, premium costs for Honda owners in those specific locations. It’s a powerful reminder that while a car’s reputation may precede it, the choices made by individual drivers ultimately shape its safety narrative.
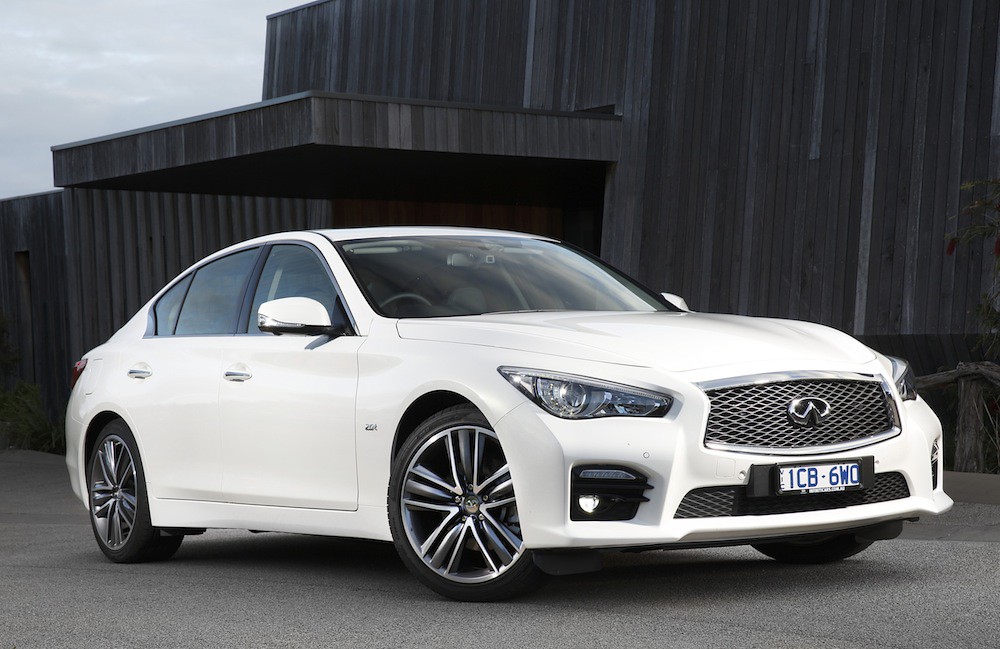
9. **Infiniti: Luxury Driving with Concentrated Offender Profiles**The Infiniti brand, a name synonymous with luxury, performance, and refined driving experiences, also features on our list with a concerning incident rate. LendingTree’s analysis indicates that Infiniti drivers are involved in 29.37 incidents per 1,000 drivers, placing them among brands whose owners demonstrate a higher frequency of problematic driving behaviors. This figure encompasses a range of infractions, from speeding to accidents, challenging the assumption that luxury car owners might uniformly exhibit more cautious driving habits.
Interestingly, the data for Infiniti points to specific geographic concentrations of problematic driving. According to the study, “Infiniti drivers in Hawaii, Rhode Island, and Vermont seem to be the biggest offenders.” This regional specificity is a crucial detail, suggesting that certain local factors—whether it be driving culture, specific vehicle usage patterns, or demographic characteristics of Infiniti owners in these states—contribute to a higher incidence of risky behavior.
The inclusion of a luxury brand like Infiniti on this list reinforces the idea that vehicle class or price point does not insulate drivers from the propensity for incidents. While Infiniti vehicles are engineered for a dynamic and engaging ride, it appears that this performance, combined with driver choices, sometimes translates into increased risks on the road. For current and prospective Infiniti owners, especially in these identified hotspots, understanding these patterns is vital for both personal safety and anticipating potential impacts on insurance premiums.

10. **Toyota: Reliability Meets Unexpected Incident Frequency**Toyota, a titan in the automotive industry revered globally for its unparalleled reliability, longevity, and practical design, might come as a surprise entry on a list detailing problematic driver profiles. However, the data reveals a different facet of its drivers’ collective behavior. Toyota drivers rank tenth on LendingTree’s list, with 29.09 incidents per 1,000 drivers, indicating a non-trivial frequency of infractions that push the brand into this less desirable category.
Delving deeper into the metrics, Toyota drivers are also associated with the eighth-highest accident rate among all brands studied. This statistic is particularly significant, as it indicates direct involvement in collisions rather than just minor citations, signaling a higher risk factor on the roads. Furthermore, the brand’s drivers are linked to the fourteenth-highest DUI rate, adding another layer of concern regarding responsible driving.
These findings suggest that while Toyota vehicles are inherently robust and often equipped with advanced safety features, the sheer volume of these vehicles on the road, combined with individual driver decisions, culminates in these elevated incident and accident rates. It serves as a potent reminder that even the most dependable car can become a liability when paired with less-than-ideal driving habits. For consumers and road safety advocates, this data highlights that no brand, regardless of its reputation for reliability, is immune to the consequences of driver behavior.
11. **Pontiac: The Unsettling Paradox of High DUI Rates**Pontiac, a brand that has since ceased production, presents a fascinating and somewhat unsettling paradox within the latest driver behavior studies. While it earns a spot among the brands with the *lowest overall incident rates* nationally, reflecting a generally calmer driver base with just 19.72 incidents per 1,000 drivers (placing it second among the ‘best drivers’ overall), a specific, critical metric paints a starkly different and alarming picture: DUIs.
In a dramatic shift, Pontiac has shockingly taken the lead for the highest DUI rate in 2024, registering 3.11 DUIs per 1,000 drivers. This represents a massive jump from 1.09 in the previous analysis, unseating BMW from its former unenviable distinction. This significant increase underscores a severe and concentrated problem with impaired driving among a segment of Pontiac owners, despite the brand’s otherwise low overall incident frequency.
The contrast between a low overall incident rate and the highest DUI rate is a powerful testament to the fact that ‘bad driving’ is not monolithic. While many Pontiac drivers may operate their vehicles without causing frequent minor incidents, a concerning proportion engage in one of the most dangerous and irresponsible behaviors on the road. This phenomenon, while attributed to an out-of-production brand, remains a critical data point for understanding the diverse facets of driver misconduct and its profound implications for public safety.
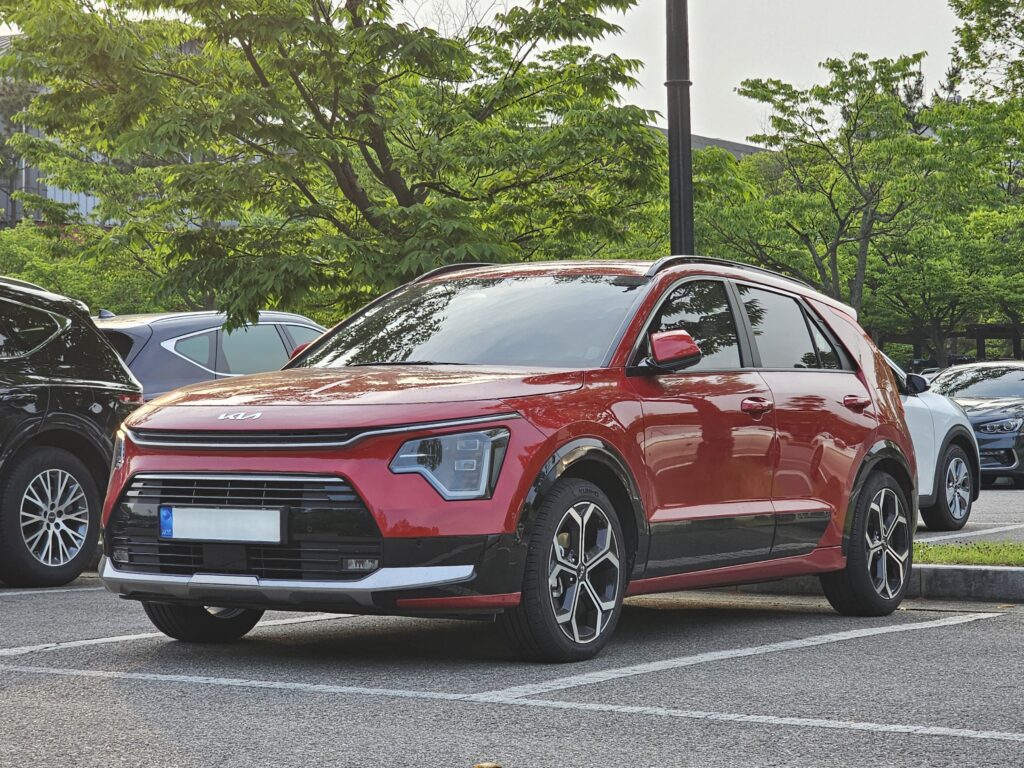
12. **Kia: Balancing Low DUIs with High Fatal Accident Rates**Kia, a brand that has seen a significant surge in popularity for its stylish designs and value proposition, presents another compelling case study in driver behavior. While Kia drivers demonstrate some of the *lowest DUI rates* among all brands, registering a mere 1.22 DUIs per 1,000 drivers—ranking them third lowest nationally—the brand’s profile is darkened by another, more severe statistic: fatal accidents.
According to an iSeeCars.com study, Kia vehicles are linked to the second-highest fatal accident rate of all car brands, with 5.5 fatal accidents per billion vehicle miles. This alarmingly high rate places Kia just behind Tesla in this critical measure of road danger. This juxtaposition of low DUI rates with high fatal accident rates suggests a complex scenario. It indicates that while Kia drivers may generally avoid impaired driving, other high-risk behaviors or factors, such as aggressive driving, speeding, or perhaps the circumstances of the accidents themselves, contribute to a disproportionate number of severe outcomes when crashes occur.
For consumers, this data is a crucial consideration. It highlights that responsible driving extends beyond avoiding alcohol; vigilance against all forms of reckless behavior is paramount. The presence of Kia on this list, despite its low DUI figures, serves as a sobering reminder that a comprehensive view of driver profiles requires examining multiple metrics to truly understand the risks associated with various brands and their respective driving communities.
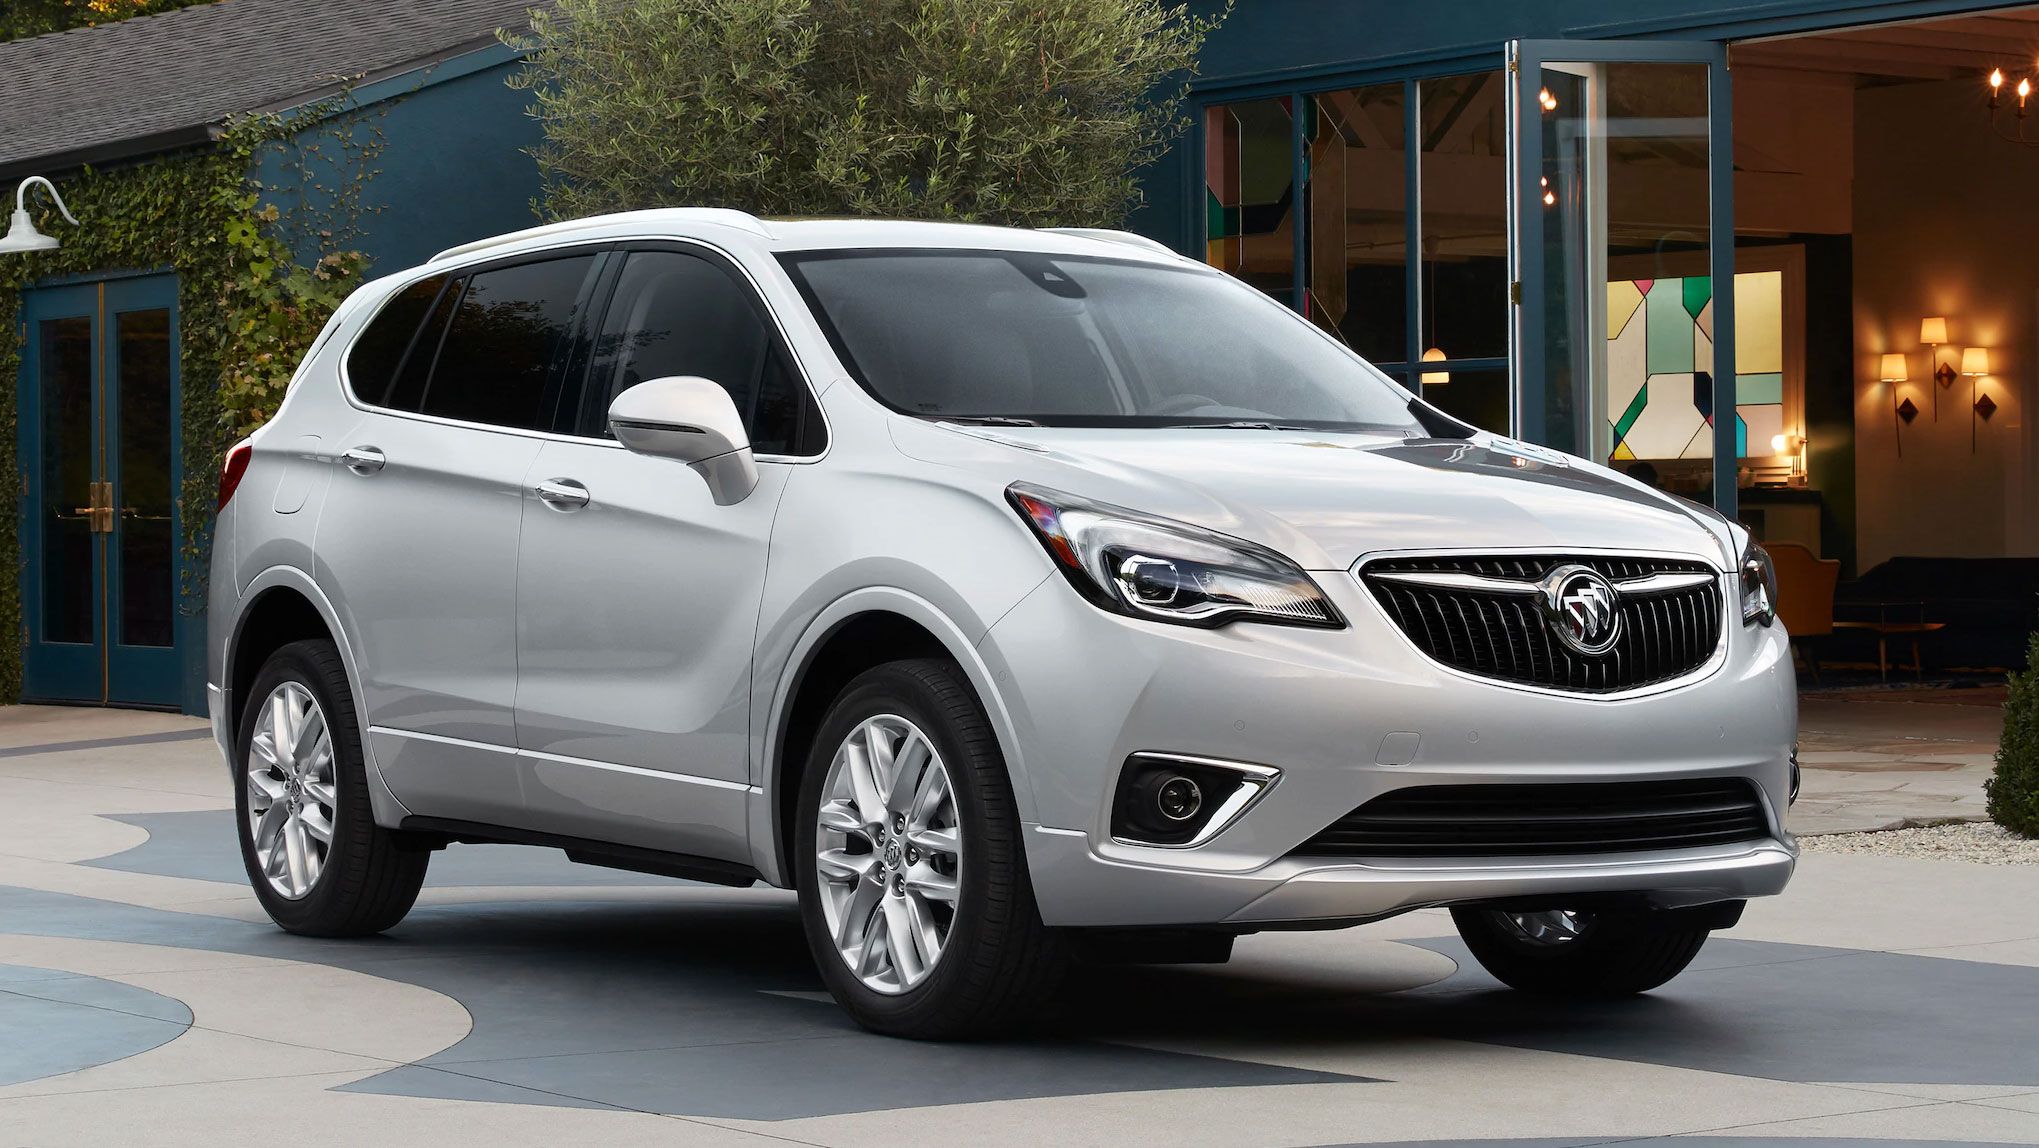
13. **Buick: A Surprising Presence in Fatal Accident Statistics**Buick, a storied American brand often associated with a mature demographic and a reputation for comfortable, if not overtly sporty, vehicles, also finds itself in the spotlight for a concerning aspect of driver behavior: fatal accidents. The iSeeCars.com study, which meticulously analyzed crash data, reveals that Buick vehicles are linked to the third-highest fatal accident rate of all car brands, registering 4.8 fatal accidents per billion vehicle miles.
This statistic is particularly striking for a brand like Buick, which doesn’t typically evoke images of aggressive or high-risk driving. Its placement so high on the fatal accident index suggests that when Buick vehicles are involved in severe crashes, the outcomes are disproportionately deadly. While the context doesn’t elaborate on specific contributing factors like speeding or DUIs for Buick drivers, this high fatal accident rate points to a serious issue within the brand’s driver profile.
It underscores that the perception of a vehicle’s owner base does not always align with the stark realities of accident data. For road safety analysts and the general public, Buick’s ranking here serves as a potent reminder that severe risks can exist across various vehicle segments. The data encourages a deeper look into the circumstances surrounding these fatal incidents, emphasizing the enduring importance of safe driving practices for all, regardless of the brand behind the wheel.

14. **Hyundai: Another High Fatal Accident Rate Despite Low DUIs**Hyundai, a rapidly growing global automotive brand known for its modern designs, technological features, and competitive pricing, also makes an appearance on the list of brands with concerning driver profiles, particularly in the realm of fatal accidents. The iSeeCars.com study placed Hyundai vehicles at the fifth-highest fatal accident rate, with 3.9 fatal accidents per billion vehicle miles. This figure indicates a notable propensity for severe outcomes when Hyundai vehicles are involved in collisions.
Similar to Kia, Hyundai drivers also demonstrate one of the *lowest DUI rates* nationally, registering 1.20 DUIs per 1,000 drivers. This creates a similar perplexing situation where a brand’s drivers are generally sober, yet still contribute to a higher number of deadly crashes. This suggests that other forms of dangerous driving behavior, such as speeding, distracted driving, or aggressive maneuvers, might be more prevalent among a segment of Hyundai drivers, leading to tragic consequences.
The data for Hyundai, much like Kia, emphasizes the multi-faceted nature of road safety. It reinforces the idea that preventing fatal accidents requires a holistic approach, addressing not only impaired driving but also other critical factors that increase the likelihood of severe collisions. For the millions of Hyundai owners, this information serves as a vital prompt to exercise extreme caution and adherence to all traffic laws to mitigate these elevated risks.

15. **Dodge: The Paradox of Fewest Incidents and High Fatalities**The case of Dodge presents one of the most compelling paradoxes in our analysis of driver behavior. On one hand, LendingTree’s study lauded Dodge for having the *fewest overall incidents nationwide* among all brands. This statistic might lead many to assume that Dodge drivers are among the safest, consistently avoiding accidents, speeding tickets, and other citations. However, another critical dataset tells a more concerning story when it comes to the severity of incidents.
An iSeeCars.com study found Dodge vehicles linked to the fourth-highest fatal accident rate, registering 4.4 fatal accidents per billion vehicle miles. This places Dodge squarely among the brands whose vehicles are disproportionately involved in deadly crashes. This striking contrast—fewest overall incidents versus high fatal accident rates—suggests that while Dodge drivers may be involved in fewer minor infractions, the incidents they *are* involved in tend to be far more severe and often tragic.
This could imply that when Dodge drivers do engage in risky behavior, or when their vehicles are involved in collisions, the consequences are more dire. It highlights that ‘safe driving’ isn’t just about avoiding tickets; it’s about avoiding fatal outcomes. This intricate data profile for Dodge compels us to look beyond single metrics and appreciate the complex layers that define a brand’s overall safety narrative on our roads.
Our journey through the latest U.S. studies on driver behavior unequivocally demonstrates that the stereotype of a ‘showoff’ car driver isn’t just anecdotal—it’s often backed by hard data. From Tesla’s leading incident rates to Ram’s state-level dominance, and from the surprising ‘speed demon’ tendencies of some Subarus to the high fatal accident rates associated with brands like Kia, Buick, Hyundai, and Dodge, the evidence is clear: the vehicle you drive can, statistically, say something about your driving profile. These findings are not merely academic; they translate directly into tangible impacts on road safety, personal well-being, and even the cost of your auto insurance premiums.
While manufacturers continually innovate with safety features and advanced technologies, the ultimate responsibility for safe driving rests firmly with the individual behind the wheel. The choices we make – whether to speed, drive distracted, or operate a vehicle while impaired – have profound consequences that reverberate across communities. As we share our roads, embracing principles of defensive driving, maintaining appropriate speeds, and avoiding distractions and impairments are universal responsibilities. Because in the end, it’s not just about the car; it’s about the driver, and collectively, we all hold the keys to safer roadways. The data urges us all to consider: what does your car say about *your* driving habits?


