

Have you ever paused to consider whether your car’s color might be doing more than just reflecting your personal style? The paint job on your vehicle, it turns out, is not merely an aesthetic choice. In the realm of road safety, the color of your car holds a surprising and statistically significant influence over its visibility, directly impacting the likelihood of it being involved in an accident. This isn’t about superstition or anecdotal evidence; it’s about physics, perception, and cold, hard data.
Our extensive analysis, drawing from numerous road safety studies and consistent research findings, reveals a clear pattern: visibility is the linchpin connecting car color to accident risk. Darker vehicles, which absorb light rather than reflecting it, become harder to detect against varying backdrops—be it a shadowy underpass, a dark road at dusk, or even a busy urban environment. This reduced visibility translates directly into less reaction time for other drivers, a critical factor in avoiding collisions. Understanding these dynamics is paramount for any consumer looking to make an informed decision that prioritizes safety.
This in-depth report unpacks the science and statistics behind car color and accident rates. We’ve meticulously ranked colors based on their empirically proven crash likelihood, providing you with credible, fact-checked information to navigate the complexities of vehicle safety. From the colors that consistently top the charts for accident involvement to those that serve as beacons of visibility, we delve into the data-driven reasons behind each ranking, empowering you to make choices that could genuinely enhance your safety on the road.
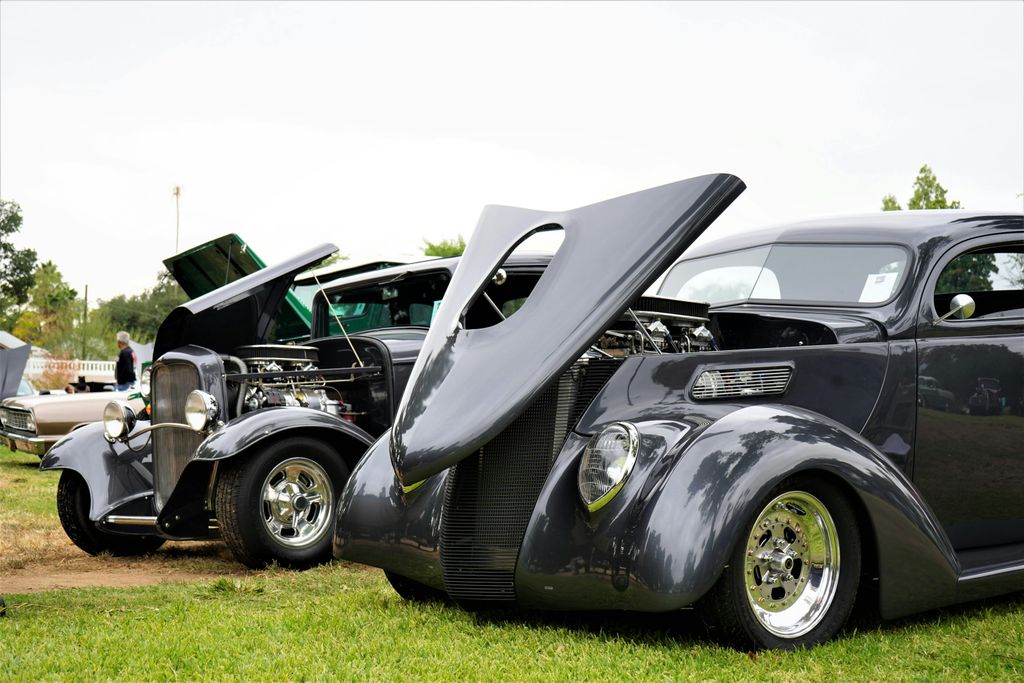
1. **Black Cars: The Undisputed Highest Risk**When we look at accident statistics, one color consistently emerges as having the highest risk: black. Research unequivocally indicates that black cars are involved in the most accidents, primarily due to their severely compromised visibility across various lighting conditions. This isn’t a marginal difference; studies show black vehicles have a risk that is a significant 12% higher than white cars, even during broad daylight hours, when contrast should theoretically be less of an issue.
The danger escalates dramatically once daylight begins to fade. In low-light conditions—whether it’s dusk, dawn, or nighttime—the risk for black cars skyrockets. Evidence suggests a staggering 47% higher crash risk compared to the safest colors on the road during these critical hours. This profound increase is a direct consequence of black’s light-absorbing properties, which cause the vehicle to blend seamlessly into darkened environments, rendering it nearly invisible to other motorists.
The core issue is the camouflage effect. A black car can appear to vanish into the shadows of the road or absorb ambient light rather than reflecting it back to other drivers’ eyes. This lack of light reflection significantly reduces the distance at which the vehicle can be detected. Compounding these issues, in adverse weather conditions like heavy rain, fog, or snow, a black car’s visibility diminishes even further, intensifying the inherent risks and making it a statistically perilous choice for driver and passenger safety.
Read more about: The Ultimate Automotive Showdown: Hybrid, Electric, and Gas Cars Face-Off on Costs, Range, and Practicality – Who Wins Your Drive?
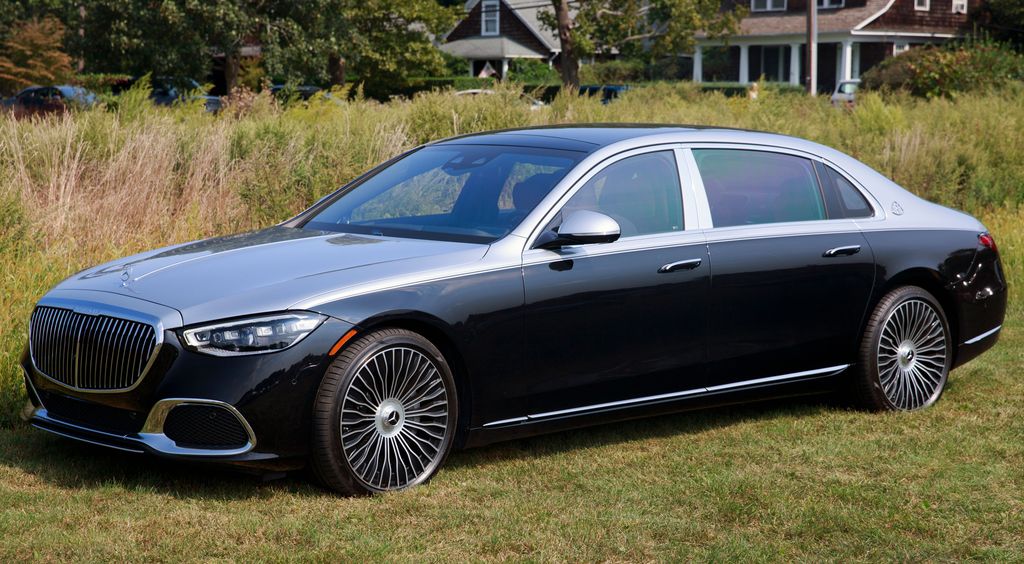
2. **Grey & Silver Cars: The Camouflage Effect**Following closely behind black in the accident risk rankings are grey and silver cars, presenting a unique set of visibility challenges due to their propensity to blend into common environmental backdrops. Grey vehicles, for instance, show an 11% higher likelihood of being involved in an accident compared to the safest colors. Their muted tones mimic the color of asphalt roads and often overcast skies, effectively creating a natural camouflage that makes them difficult to distinguish for other drivers.
Silver cars, while often perceived as sleek and modern, carry a 10% increased crash risk. Their specific visibility issues are multifaceted; they can easily disappear into rainy, foggy, or overcast conditions, much like grey cars. Additionally, the reflective quality of silver can sometimes create glare that paradoxically obscures their distinct shape against a bright or wet background, making it harder for others to accurately gauge their presence and proximity on the road.
Industry analysis consistently indicates that the primary flaw of both grey and silver vehicles lies in their tendency to match the color palette of urban environments and common weather phenomena. While some studies suggest silver might offer higher visibility in certain extremely bright conditions due to its reflectivity, the more prevalent finding points to its blend-in capabilities during challenging weather as a significant safety drawback. This nuanced understanding underscores that car color risk is not a singular factor but rather a complex interplay between the vehicle’s hue and its surroundings.
Read more about: Car Color and Your Chances: A Consumer Reports Guide to Visibility, Accidents, and Traffic Stops
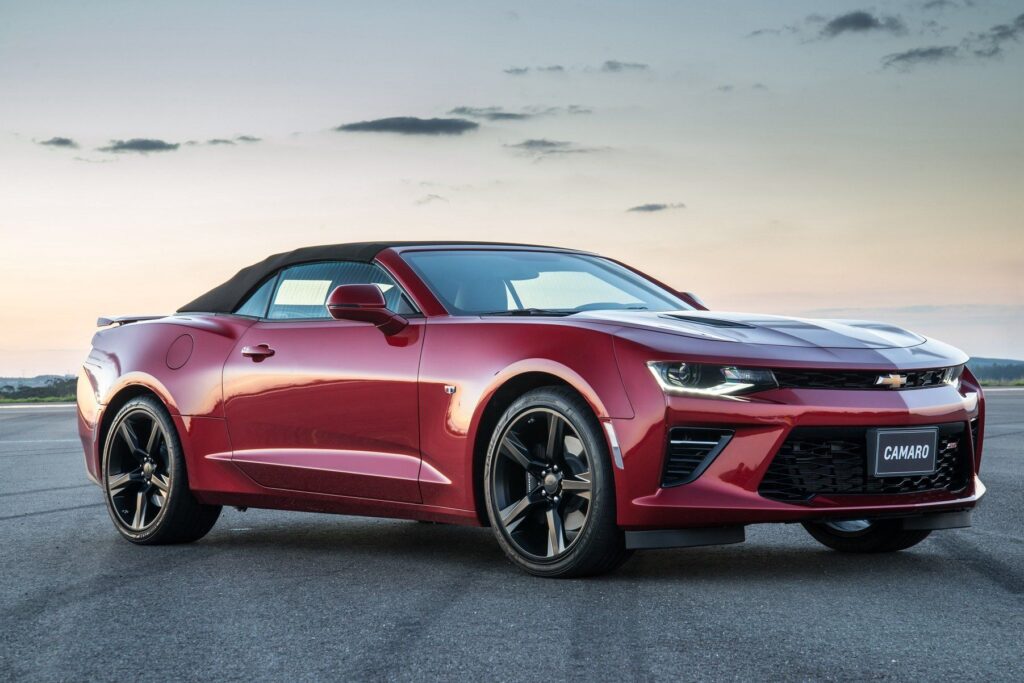
3. **Dark Blue & Red Cars: When Color Becomes Background Noise**It’s a common misconception that red cars are involved in more accidents because they are driven faster or more aggressively. However, data from well-established research refutes this popular myth. The reality is that both dark blue and red cars carry a 7% higher accident risk, and the reason lies in a visibility problem, specifically their tendency to get lost in the visual ‘noise’ of the driving environment rather than standing out. This makes them less conspicuous than many drivers might assume.
For red cars, the challenge stems from the ubiquitous presence of the color red on our roadways. Red is universally used for critical safety signals—think stop signs, traffic lights, and the essential brake lights of every vehicle on the road. A red car, no matter how vibrant, can easily become part of this intense visual backdrop. This ‘background noise’ effect means other drivers may experience a delayed reaction time when perceiving a red vehicle, as it doesn’t offer enough contrast against the vital warning signals it shares a color with.
Dark blue cars face a similar percentage of increased risk, but for different reasons. They can blend subtly into the twilight sky during dawn or dusk, periods when natural light is ambiguous. Furthermore, in areas with deep shadows cast by tall buildings or dense trees, a dark blue vehicle can virtually disappear, making it incredibly difficult for other drivers to spot. Both colors, therefore, illustrate how a seemingly noticeable hue can paradoxically become an indistinguishable part of the visual landscape, diminishing a driver’s active safety.

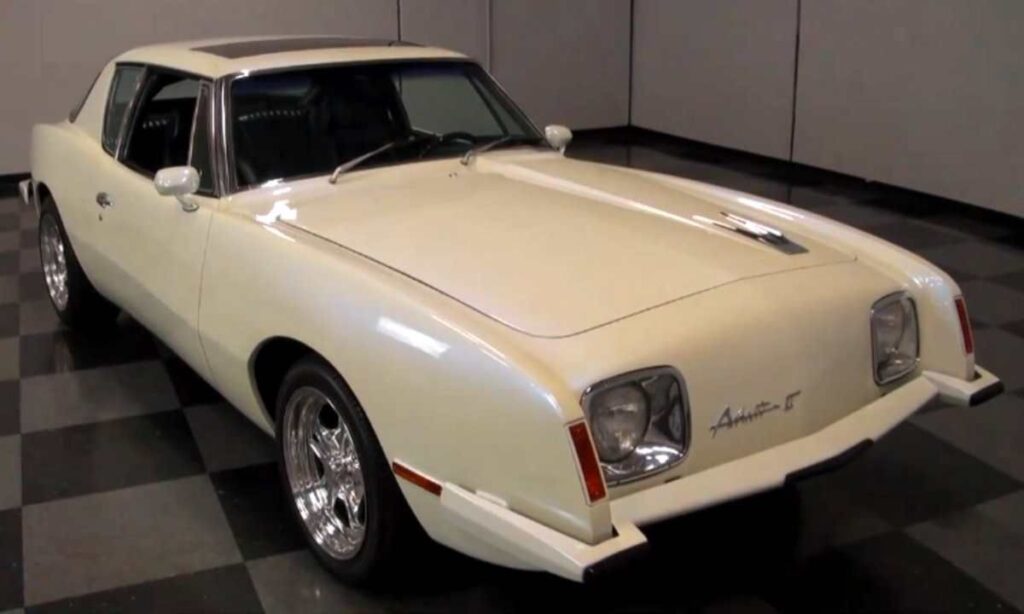
4. **White Cars: The Benchmark for Safety**When it comes to vehicle safety, white consistently stands out as the undisputed safest car color. Data-driven analysis confirms that white cars are remarkably 12% less likely to be involved in a crash compared to black cars, establishing it as the benchmark against which other colors are measured. This significant safety advantage isn’t a matter of chance; it’s rooted in the color’s inherent properties and how it interacts with its environment.
The effectiveness of white is both simple and powerful: it reflects the maximum amount of light across the visual spectrum. This high reflectivity ensures superior contrast against virtually all backgrounds encountered on the road, including dark asphalt, shadowy areas under bridges, and stormy, overcast skies. Whether you are navigating traffic at midday, enduring a heavy downpour, or driving as dusk begins to settle, a white vehicle provides other motorists with a clear, unambiguous visual cue of its presence.
This consistent and exceptional visibility is the cornerstone of white’s safety advantage. It allows surrounding drivers more crucial time to perceive the vehicle, process its movements, and react appropriately to avoid a potential collision. The statistical significance of white’s lower accident rate makes it a pragmatic and highly recommended choice for consumers prioritizing passive safety features in their vehicle selection. It’s a simple decision with a tangible impact on accident prevention.
Read more about: The 14 Most Overpriced Cars in the Market Right Now: What Experts and Data Reveal for Smart Buyers
5. **Yellow, Orange & Gold: The High-Visibility Champions**While white cars serve as the benchmark for overall safety, certain other bright colors are true champions of pure visibility, offering exceptional contrast against almost any background. Yellow and orange, for instance, are exceptionally safe choices because they stand out starkly, making them highly conspicuous to other drivers. These vibrant hues are deliberately employed in critical applications where being seen is paramount, underscoring their effectiveness as safety enhancers.
Yellow, in particular, is often cited as one of the safest colors due to its remarkable prominence in the human spectrum of vision. It is, in fact, one of the first colors the human eye notices, a key reason why it is the mandated color for school buses across North America and a widely popular choice for taxis worldwide. Its vividness ensures it dramatically contrasts against nearly any natural or urban backdrop, significantly reducing the chances of it going unnoticed.
Orange offers a similar, unmissable profile. Because very few elements in the natural environment or urban infrastructure are bright orange, a car of this color rarely blends in, maintaining excellent visibility in most weather conditions. Gold vehicles also fall into the safer category, providing a light, reflective surface that notably enhances visibility compared to darker, more neutral tones. Choosing one of these high-visibility colors is a proactive decision that ensures your vehicle is harder for other drivers to ignore, contributing meaningfully to your road safety strategy.
6. **Car Color and Police Attention: Debunking Myths and Unpacking Data**Beyond the realm of accident risk, many consumers wonder if their car’s color impacts its likelihood of attracting police attention and, consequently, traffic stops. This is a common area of urban legend, particularly regarding red cars. However, data on traffic citations is less conclusive than accident data, often revealing conflicting insights from different studies. It is important to note that, fundamentally, traffic stops are primarily based on driving behavior and violations, not solely on a vehicle’s hue.
Contradicting popular belief, one study by Quality Logo Products, which surveyed over 2,000 drivers, found that white cars are pulled over the least, followed by gray, silver, and black vehicles. This research suggests that neutral, common colors are less likely to draw attention from police on patrol, allowing them to blend in more easily with other traffic. Conversely, bright colors like yellow and red were reported as being stopped the most in this particular survey, indicating that standing out can indeed attract unwanted scrutiny.
However, other data presents a different perspective. The National Motorists Association, for instance, indicates that white-colored vehicles actually get pulled over the most, with red vehicles coming in second, followed by gray and silver. The association attributes white cars being stopped frequently to the fact that white is the most common vehicle color on the road. This conflicting information underscores the complexity of quantifying the impact of car color on police attention, highlighting that other factors often play a more decisive role than color alone.
7. **Beyond Color: Vehicle Type and Condition as Factors in Traffic Stops**While car color can subtly influence an officer’s initial notice, the type of vehicle itself and its overall condition are far more significant determinants in attracting police attention. Certain vehicle categories inherently stand out more than others, altering the likelihood of a traffic stop. For example, large trucks, commercial vehicles, and high-performance sports cars tend to garner more scrutiny from law enforcement officials, making them more prone to stops.
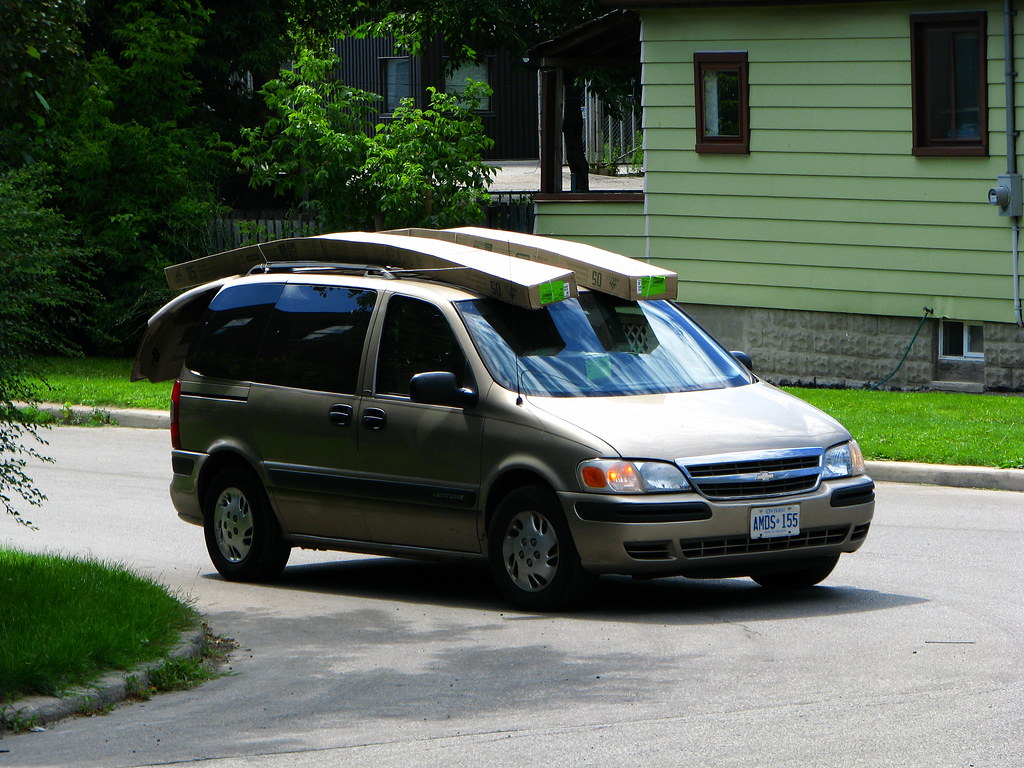
Conversely, more conservative and family-oriented vehicles are less conspicuous. A poll by Far & Wide Finance revealed that minivans receive traffic citations at the lowest rate compared to other vehicle types, with only 13% of minivan drivers reporting being pulled over in the past five years. Midsize and full-size sedans also rank low on the list for stops, blending in effortlessly with general traffic. This suggests that vehicles perceived as less aggressive or less likely to be involved in reckless driving tend to attract less police scrutiny.
Furthermore, the physical condition and maintenance of a vehicle play a critical role. Cars that appear poorly maintained or have visible equipment violations may raise an officer’s suspicion and warrant a stop. Common defects that attract attention include expired or missing license plates, non-functioning lights, a cracked windshield, bald tires, a heavily dented or rusted exterior, smoke from the exhaust, or an excessively loud exhaust system. Addressing these issues not only ensures roadworthiness but also helps drivers avoid attracting unwanted attention from patrol officers, contributing to a smoother driving experience.
Read more about: Hybrid vs. Electric Cars: The Definitive Guide to Which One Truly Saves You Money (Shocking Truth)
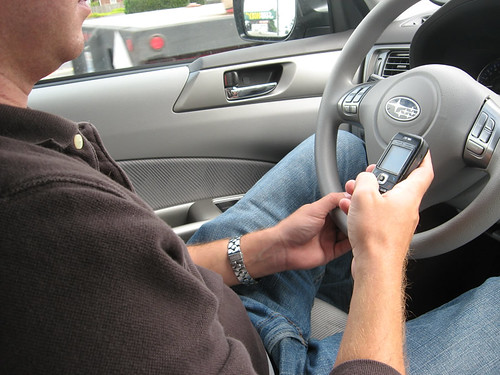
8. **The Human Element: Driver Behavior and Demographics in Traffic Enforcement**Ultimately, a driver’s behavior is the paramount factor influencing the likelihood of being pulled over. Officers are primarily focused on driving maneuvers that indicate impaired, reckless, or illegal activity. Drivers who consistently maintain the speed limit, utilize turn signals appropriately, and avoid sudden acceleration or braking are far less likely to stand out. Safe driving habits, such as avoiding distractions, maintaining adequate distance between vehicles, and staying in appropriate lanes, are key to preventing police attention.
In stark contrast, behaviors such as speeding, frequent lane changes, tailgating, erratic braking, failure to signal turns, swerving, or weaving between lanes significantly increase a driver’s chances of being stopped. Even driving significantly under the speed limit can attract attention, as it might suggest impairment or distraction. These active choices behind the wheel hold far more weight than any aesthetic characteristic of the vehicle, directly impacting an officer’s decision to initiate a traffic stop.
Compounding these factors, unfortunately, driver demographics also play a role, albeit an unfair one, in the likelihood of being pulled over. A study by the Bureau of Justice Statistics indicated that men were pulled over at nearly twice the rate of women—16% versus 9%. Young drivers, specifically those aged 16-24, were stopped the most frequently, followed by the 25-29 age group. The study also revealed that Black (13%) and Hispanic (10%) drivers were pulled over more often than white drivers (8%). While individual officers may not be consciously aware of these implicit biases, the data suggests that demographic factors can subtly influence decisions regarding which vehicles to target for stops.
9. **Contextual Factors: Time of Day, Vehicle Age, and Out-of-State Plates**Beyond individual driver characteristics and vehicle attributes, several contextual elements contribute to the probability of a traffic stop. The time of day significantly influences police patrol patterns and enforcement activity. Late night and early morning hours (1 AM to 5 AM) often see fewer officers dedicated to traffic duty, potentially leading to lighter enforcement. Similarly, mid-day periods on weekdays (1 PM to 3 PM) can also have reduced traffic enforcement compared to peak times. This is in contrast to rush hour periods, typically early morning and late afternoon, when roads are congested and enforcement is heavier, as officers are positioned along major commuting routes.
Holiday weekends and major events like concerts or sports games also experience intensified enforcement, with police actively seeking impaired drivers. Analyzing local police department activity trends can provide drivers with insights into peak enforcement times, enabling them to adjust their driving habits to avoid attracting additional attention during these periods. Remaining vigilant and adhering strictly to traffic laws is especially crucial during these high-enforcement windows.
The age of a vehicle also plays a statistically significant role. Data analysis by Insurify, based on over 1.6 million traffic stops, revealed that vehicles over 16 years old received citations at a rate 15% higher than newer cars less than 5 years old. Older cars are generally more prone to developing equipment issues that violate vehicle codes, such as cracked windshields, missing reflectors, or faulty taillights. While any car can develop defects, older models tend to exhibit more signs of deterioration, which officers are trained to notice, potentially leading to a stop even for minor infractions.
Finally, vehicles bearing license plates from a different state often attract increased scrutiny from patrol officers. Out-of-state drivers are frequently presumed to be unfamiliar with local speed limits and traffic laws, making them more likely targets. A nationwide traffic stop study found that vehicles with out-of-state plates were cited at 17% higher rates for speeding compared to in-state drivers, particularly in densely populated areas where interstate travel is common. This disparity suggests that officers may be more confident issuing citations to non-local drivers, who are perceived as less likely to contest tickets or appear in court, underscoring the need for extra caution when driving in unfamiliar jurisdictions.
10. **Car Color and Theft Risk: Blending In vs. Standing Out**While visibility is a key factor in accident prevention, the role of car color in deterring theft presents a different set of considerations. Thieves, motivated by convenience, value, and availability, are generally drawn to vehicles that are easy to steal, blend in, and offer lucrative aftermarket parts sales. This often means older, popular models with fewer advanced anti-theft systems become primary targets. Contrary to some popular myths, red cars do not appear to be more frequently stolen; NRMA Insurance data, for instance, indicates that green and black cars are far more appealing to car thieves, with red cars having a lower reported theft rate.
The colors most at risk for being reported stolen are those that effectively blend into the crowd, making them less conspicuous to law enforcement and witnesses alike. This includes popular, neutral tones such as white, gray, and silver models. A study shared by Edmunds, analyzing data from the Netherlands between 2004 and 2010, found that blue and silver cars were stolen almost 40% more often, suggesting that their ability to go unnoticed in urban environments makes them more desirable to criminals. Thieves prioritize anonymity and ease of disposal, making common, less distinctive colors more appealing for illicit purposes.
Conversely, when it comes to the car color least likely to be stolen, the data points towards bolder, more vibrant hues. Dutch economist Ben Vollaard’s theory, as shared by Edmunds, suggests that a brightly colored car, such as yellow or orange, is significantly harder to identify and resell in the black market. These bold colors often indicate newer models equipped with better anti-theft systems, further deterring thieves. The difficulty in unloading a neon-green car, for example, compared to a white one, reduces its overall resale value in the hands of a criminal. Therefore, the moral of this color-coded tale is clear: a bold car color can serve as a surprising deterrent against theft, making your vehicle less attractive to would-be crooks.
**Final Summary: Choosing a Safer Car Color**
In navigating the complex interplay between car color, safety, and operational considerations, the data consistently reveals critical insights for consumers. For accident prevention, visibility is paramount. Black cars consistently carry the highest accident risk due to their low visibility, especially in challenging lighting conditions, while white cars stand as the benchmark for safety, offering superior contrast across varied environments. Bright, high-visibility colors like yellow and orange also prove exceptionally safe, standing out prominently to other drivers.
When considering police attention, the relationship with car color is more nuanced, with some studies suggesting neutral colors attract less notice, while others point to popular colors being stopped more frequently. However, it is unequivocally clear that driver behavior, vehicle maintenance, and other contextual factors like time of day and vehicle type exert a far greater influence on traffic stops than color alone. Regarding car theft, the dynamic shifts: bold, easily identifiable colors act as a deterrent, making them less appealing to thieves who prefer inconspicuous vehicles that blend into the urban landscape and are easier to resell.
Read more about: Beyond the Showroom Shine: A Mechanic and Enthusiast’s Unvarnished Truth About 13 Cars and Why New Isn’t Always Better
Ultimately, while your driving habits—staying focused, sober, and defensive—remain the most critical components of road safety, the choice of car color offers a passive yet tangible contribution. Consumers are empowered by this data to make informed decisions that enhance both their active and passive safety, whether by prioritizing a highly visible color to reduce accident risk or by selecting a distinctive hue that might deter theft. Every decision, from the color of your car to your conduct behind the wheel, plays a role in fostering a safer driving experience for all. Make your choices wisely, armed with the knowledge to navigate the road with confidence and security.


