

The quest for better fuel efficiency is a perennial concern for vehicle owners, especially when gasoline prices are on the rise. Manufacturers often advertise impressive Miles Per Gallon (MPG) figures, which are then reinforced by Environmental Protection Agency (EPA) estimates displayed prominently on window stickers. These numbers are a crucial factor for many consumers when making a purchasing decision, promising a certain level of economy and performance, and shaping expectations for running costs.
However, a significant gap often emerges between these official figures and the actual fuel economy experienced by drivers in their daily lives. This disparity has led to widespread frustration and a growing skepticism among car and truck owners. Consumers frequently find that the “best fuel efficiency [they] can get is a measly 24 mpg average,” despite a vehicle being rated “30 mpg on the highway and 28 mpg overall.” This complex issue is not merely a matter of individual driving habits, but one deeply rooted in how these ratings are established and the myriad variables encountered in real-world operation.
The recent controversies surrounding fuel efficiency claims, particularly involving major automakers, have cast a spotlight on the entire system. Understanding why some MPG ratings “just isn’t forever” requires a closer look at the testing protocols, the reporting mechanisms, and the intricate factors that influence a vehicle’s performance once it leaves the dealership lot. This in-depth article will delve into these critical aspects, providing consumers with a clearer picture of what to expect and why their mileage may not always match the sticker.

1. **The Fundamental Discrepancy: EPA Ratings vs. Real-World Driving**The journey for a new car buyer often begins with high hopes for impressive fuel economy, driven by advertised figures and official EPA estimates. These ratings, prominently displayed on vehicle window stickers, represent a significant selling point, influencing purchasing decisions for millions of consumers. They create an expectation of a certain level of performance and considerable cost savings at the pump, which becomes a key part of a vehicle’s perceived value.
Yet, a common narrative among vehicle owners is the frequent disappointment when their actual fuel efficiency falls short of these promised numbers. This experience of getting a “measly 24 mpg average” from a car rated at “30 mpg on the highway and 28 mpg overall by the Environmental Protection Agency (EPA)” is a widespread phenomenon. It leaves consumers feeling that the “joke is on them,” questioning the reliability of the figures designed to guide their choices and feeling misled by the initial promise.
This discrepancy isn’t just a minor annoyance; it’s a source of considerable frustration, especially when fuel prices escalate. The gap highlights a fundamental challenge: bridging the controlled environment of standardized testing with the unpredictable, varied reality of daily driving. The inherent variability means that the “idea of an absolutely accurate rating of average mpg is laughable” in the face of so many real-world influences that simply cannot be fully captured by a single number. This consistent divergence between laboratory results and on-road performance underscores the need for consumers to understand the context and limitations of these official ratings.

2. **The Hyundai/Kia Fuel Economy Scandal: A Case Study in Overstated Claims**One of the most significant recent events to shake consumer confidence in fuel efficiency claims was the scandal involving Hyundai Motor Corp. and its sister company, Kia Motors. The issue gained prominence when Hyundai’s 2011 and 2012 Elantra models were advertised with a highway rating of “40 mpg,” a figure many customers found almost impossible to replicate in their own driving. This perceived overstatement ignited considerable public outcry.
Customer dissatisfaction mounted, with “hundreds of complaints from Hyundai customers” reporting that the mileage they were experiencing “wasn’t even coming close to the official EPA estimates posted on the vehicles when they were on the dealers’ lots.” This wave of consumer feedback eventually caught the attention of regulatory bodies, triggering a thorough investigation into the accuracy of the submitted data.
The EPA’s investigation ultimately exposed significant “flaws in its testing procedures” which the automakers later attributed to an “error by its South Korean test crew.” This unprecedented breach of trust led the EPA to require both companies “to roll back fuel-efficiency numbers on a total of 13 models.” This substantial correction was particularly noteworthy because, prior to this, “only two rollbacks had been ordered in the past decade, each for a single model,” making the Hyundai/Kia situation an exceptional case of widespread inaccuracy.
In response to the mandatory rollbacks, Hyundai and Kia issued a joint statement, acknowledging the error and outlining a compensatory plan. They committed to offering customers “a personalized debit card that will reimburse them for their difference in the EPA combined fuel economy rating, based on the fuel price in their area and their own actual miles driven.” This incident served as a stark reminder of the potential for inaccuracies and the critical importance of stringent oversight in fuel economy reporting, highlighting a moment when consumer vigilance truly made a difference.
Car Model Information: 2025 Hyundai ELANTRA SEL Convenience
Name: Hyundai Elantra/Avante
Manufacturer: Hyundai Motor Company
Aka: Hyundai Avante,Hyundai Lantra (1990–2000, Australia and Europe),Hyundai i30 Sedan (2020–present, Australia)
Production: 1990–present
Class: Compact car
Layout: Front-engine, front-wheel-drive layout
Predecessor: Hyundai Stellar
Categories: 2000s cars, 2010s cars, 2020s cars, All Wikipedia articles written in British English, All articles with bare URLs for citations
Summary: The Hyundai Elantra (Korean: 현대 엘란트라), also known as the Hyundai Avante (Korean: 현대 아반떼), is a series of compact cars produced by the South Korean manufacturer Hyundai since 1990.
In South Korea, the first-generation model was initially sold under the “Elantra” nameplate, but starting from the second-generation, Korean models were sold under the “Avante” nameplate, with the “Elantra” name continue to be used on export models. The “Avante” name is not used in most export markets due to its similarity with Audi’s “Avant” designation, used for their station wagon models. As of 2018, Singapore is the only export market outside South Korea to utilize the “Avante” name.
In Australia and some European markets, the Elantra was initially marketed as the Lantra during its first two generations, due to the similarly named “Elante” trim for the Mitsubishi Magna in the former market, and the Lotus Elan in the latter. After Mitsubishi Motors Australia Limited (MMAL) dropped the “Elante” trim from the Magna range, and Lotus ceased production of the Elan in 1995, Hyundai standardized the “Elantra” name for both Australian and European markets in 2001, following the introduction of the third-generation model.
The first-generation model was also sold as the Bimantara Nenggala in Indonesia between 1995 and 1998. Since the seventh-generation, the “Elantra” name was retired in Australia, when Hyundai intergrated it into the i30 range, badging it as the i30 Sedan.
Get more information about: Hyundai Elantra
Buying a high-performing used car >>>
Brand: Hyundai Model: Elantra
Price: $22,033 Mileage: 8,009 mi.

3. **Automaker Self-Testing: The Foundation of EPA’s Rating System**The general public often assumes that the EPA, as the regulatory body, is directly responsible for conducting all the tests that yield the fuel economy figures displayed on new car stickers. This perception, however, belies the actual operational framework of the system. For many, learning how the system truly functions provides an “eye-opening look at how the system works,” revealing a reliance on manufacturer input.
In reality, the EPA “doesn’t have the budget, equipment or manpower to test the hundreds of individual models with unique engine and transmission combinations that automakers produce each year.” The sheer volume and complexity of the modern automotive market make it logistically unfeasible for a single agency to perform every test in-house, necessitating a different approach to generating the vast amount of data required.
Instead, the agency delegates this considerable task to the very entities whose products are being evaluated: the auto companies themselves. The EPA “establishes the tests that yield the fuel economy figures” and then “gives its test protocols to the auto companies.” It is then up to each manufacturer to “test its own cars and trucks” strictly following these federal guidelines and subsequently submit their findings to the agency for review. Crucially, the EPA “accepts as true the ‘EPA estimated’ fuel-efficiency numbers each car company submits.”
This self-reporting mechanism places a significant onus of integrity on the automakers, who are expected to adhere rigorously to the “very specific, federally mandated testing cycles.” While efficient, this approach inherently carries the risk of discrepancies, whether resulting from accidental procedural errors or, as some consumer advocates might suggest, potentially deliberate efforts by “one or more automakers to game the system.” The integrity of this model is paramount, relying heavily on ethical conduct and precise execution by manufacturers.

4. **EPA’s Spot-Check Mechanism: Its Strengths and Limitations**To provide a vital layer of accountability and oversight within the self-testing system, the EPA implements a crucial safeguard: a program of “scores of spot checks each year.” This independent verification process involves the agency selectively retesting a number of vehicles already on the market to ensure that the submitted fuel economy figures align with their own empirical findings. The primary goal of these spot checks is explicitly to “keep the industry honest.”
The efficacy of this mechanism was notably demonstrated during the Hyundai/Kia fuel economy scandal. The fact that the “inflated Hyundai and Kia fuel economy figures were caught and ordered corrected by the EPA is even better” than the automakers’ eventual admission itself, serving as concrete proof that “the agency’s system works.” This incident, while a significant breach, ultimately validated the necessity and effectiveness of the EPA’s audit process in identifying non-compliance and enforcing rectifications.
However, the limitations of this system also became evident in the very case it helped uncover. It “took the EPA two years to act after fielding hundreds of complaints from Hyundai customers,” suggesting that while the mechanism works, its response time may not always be rapid enough to address widespread issues promptly. Furthermore, the rarity of previous rollbacks—”only two rollbacks had been ordered in the past decade, each for a single model”—before the Hyundai/Kia situation, also indicates that while generally effective, significant breaches can occur and persist before being identified and corrected by the spot-check program alone.
The balance between trusting manufacturer data and performing sufficient oversight remains a delicate one. While the spot-check system is an invaluable tool for consumer protection, its capacity to catch every instance of deviation continues to be a point of discussion among consumer advocates calling “for the agency to conduct an industry-wide verification of fuel-efficiency claims.”

5. **The ‘Real World’ Variable: Why Driving Conditions Matter More Than You Think**Beyond the testing protocols and reporting integrity, a fundamental and often underestimated reason for the disparity between official MPG ratings and actual consumer experience lies in the vast, uncontrollable variables of “real people drive real cars in the real world.” The standardized tests, by their very nature, are conducted under specific, controlled laboratory conditions, essential for ensuring repeatability and comparability across different vehicle models.
However, these ideal conditions rarely, if ever, perfectly replicate the dynamic and unpredictable nature of everyday driving. A multitude of environmental and operational factors come into play, each capable of influencing fuel consumption significantly. These include variables such as ambient air temperature, road surface friction, prevailing wind conditions, actual terrain, and even the quality and octane of the fuel being used.
Moreover, the way a vehicle is driven is arguably the most significant variable. Tire pressure, crucial for optimal fuel economy, is often overlooked. The weight of the vehicle, encompassing not just its intrinsic mass but also the number of passengers, cargo, and even accessories, directly affects the energy required to move it. Perhaps most importantly, a driver’s individual style—how frequently and aggressively they accelerate, the intensity of their braking, and whether they “drive a little faster than the speed limit”—plays a substantial role in determining real-world fuel consumption. The context explicitly states, “There are so many variables that the idea of an absolutely accurate rating of average mpg is laughable.”
Consequently, while the EPA ratings provide a standardized benchmark for comparison, they function more as a guide than a guarantee. They offer a theoretical maximum or an idealized average achieved under very specific, controlled conditions, which almost invariably differ from the diverse and fluid scenarios drivers encounter daily. Understanding this inherent limitation is crucial for consumers to manage their expectations realistically and recognize that real-world fuel economy is a highly individualized outcome, constantly influenced by countless interacting elements beyond the scope of any single standardized test.
6. **The City vs. Highway Dichotomy: EPA’s 55/45 Split Assumption**A critical component in how the EPA calculates a vehicle’s “combined mpg” rating, representing its average fuel economy, is the assumed split between city and highway driving conditions. This established methodology posits a fixed proportion of driving scenarios: specifically, “55 percent of the time in the city and 45 percent of the time on the highway.” This split is designed to reflect a generalized driving pattern for the average motorist, aiming for a composite figure broadly representative of typical usage.
The fundamental rationale behind this distinct classification is rooted in the physics of vehicle operation and engine efficiency. As the context clearly states, “Almost all cars and trucks deliver better fuel economy while cruising at 55 mph on the open highway than they do while stopping and starting at low speed on city streets.” Highway driving typically allows the engine to operate within its most efficient RPM range, involving more consistent speeds, fewer accelerations and decelerations, and minimal idling, all contributing to significantly greater fuel efficiency.
Conversely, city driving is characterized by its demanding and often inefficient nature. It involves frequent stops and starts, lower average speeds, extensive idling at traffic lights or in congestion, and more dynamic changes in engine load as drivers navigate urban environments. Each acceleration from a standstill and subsequent braking event consumes a disproportionate amount of fuel compared to steady cruising, making city driving inherently less efficient.
However, the challenge arises because “Most people simply assume that’s the case in their own driving,” when in reality, their personal driving mix might be significantly different from the EPA’s idealized 55/45 split. Many commuters, particularly “those in urban regions with lots of traffic congestion,” often “spend far more time driving in city conditions than they do on the open road.” This divergence from the standardized ratio is a major contributor to the perceived gap between advertised and actual fuel efficiency, as a heavier lean towards less efficient city driving naturally lowers the overall MPG average. It is also crucial for consumers to recognize that even “when a lot of driving time is spent on a highway or freeway, it only counts as highway driving when the average speed is 50 mph or so.”
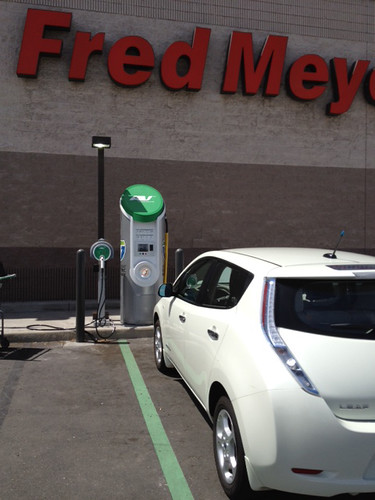
7. **The Hybrid and EV Exception: Redefining Efficiency Metrics**Just to further confuse the issue of fuel-efficiency ratings, the city-worse/highway-better driving pattern doesn’t hold up when it comes to hybrids and electric-drive vehicles. This fundamental shift in efficiency dynamics poses a unique challenge for consumers accustomed to traditional gasoline vehicle performance expectations. Understanding these distinctions is crucial for accurately interpreting the advertised fuel economy of electrified vehicles.
These vehicles achieve improved fuel efficiency at lower speeds primarily through their electrical systems. A hybrid car, for instance, uses its electric motor to stop and start a gas-powered engine, minimizing fuel consumption during frequent urban traffic conditions. Battery-electric vehicles, on the other hand, deliver electric-only propulsion, completely eliminating gasoline use in certain driving modes.
The EPA’s rating procedure for plug-in hybrids and battery-electrics is relatively new and likely will need some additional fine-tuning as the technology evolves. Early examples, like the 2012 Fisker Karma, showcased how manufacturer tests could promise 50 miles of range in all-electric mode if it starts out with a fully charged battery. This highlights the importance of consumers understanding how these ratings are derived, especially regarding electric range and what happens once the battery charge is depleted, a gasoline engine takes over.
This particular characteristic of hybrids and EVs means that urban drivers, who typically experience lower MPG in conventional vehicles, might see significantly better efficiency from electrified options. Conversely, continuous high-speed highway driving, where regenerative braking opportunities are fewer, might diminish the relative advantage of an electric powertrain. Therefore, the ideal driving environment for maximizing fuel efficiency differs considerably between conventional and electric-assisted vehicles.

8. **The Broader Landscape of Fuels: From Ancient Practices to Modern Challenges**At its core, fuel refers to any materials that can react with other substances to release energy as thermal energy or to be used for work. Initially, this concept focused solely on chemical energy release, primarily through combustion. However, it has expanded to encompass other formidable sources of heat energy, such as nuclear energy (via nuclear fission and nuclear fusion). This broad definition helps frame the diverse energy landscape.
Humanity’s journey with fuels began profoundly early, with the combustion of firewood by Homo erectus nearly two million years ago. For much of history, humans relied exclusively on fuels derived from plants or animal fat. Over millennia, this evolved to include derivatives like charcoal, a wood derivative, which has been used since at least 6,000 BCE for melting metals, and later, crude oil and coal. These historical shifts illustrate a continuous quest for more efficient and potent energy sources.
The Industrial Revolution marked a pivotal acceleration in fuel use, driven by the advent of technologies like the steam engine, which came into more common use around 1769. Fossil fuels were rapidly adopted due to their concentrated energy and versatility, becoming the backbone of modern society. Today, there is a distinct global trend towards renewable fuels, such as biofuels like alcohols, as concerns over environmental impact grow. This ongoing evolution underscores a critical background to present-day fuel efficiency discussions.
9. **Chemical Fuels: Understanding the Diverse Types and Their Energy Potential**Chemical fuels are fundamentally substances that release energy by reacting with substances around them, most notably by the process of combustion. For practical understanding, these fuels are categorized in two primary ways. They are classified by their physical properties, as a solid, liquid or gas, and on the basis of their occurrence: primary (natural fuel) and secondary (artificial fuel). This structured classification helps to understand their diverse applications.
Solid fuels encompass materials like wood, charcoal, peat, and coal, which have historically been central to human energy needs. Coal was the fuel source which enabled the Industrial Revolution, from firing furnaces, to running steam engines. While some solid fuels persist in electricity generation today, their use is increasingly regulated or restricted or prohibited in some urban areas, due to unsafe levels of toxic emissions. This highlights a balance between energy utility and environmental responsibility.
Liquid fuels are pivotal to modern transportation, characterized as combustible or energy-generating molecules that can be harnessed to create mechanical energy, usually producing kinetic energy. They are favored for being easy to transport and can be handled easily and are generally relatively easy to use for all engineering applications and in home use. Most widely used liquid fuels, such as gasoline and conventional diesel, are derived from the fossilized remains of dead plants and animals. Other types include kerosene, ethanol, and hydrogen fuel.
Gaseous fuels, including natural gas and propane, are distinguished by their ability to be readily transmitted and distributed through pipes from the point of origin directly to the place of consumption. While offering advantages over solid and liquid fuels in terms of spillage dangers, their gaseous nature presents a unique safety concern. It is possible for a fuel gas to be undetected and collect in certain areas, leading to the risk of a gas explosion, necessitating the addition of odorizers for detection.
Biofuels represent another category within chemical fuels, defined as solid, liquid, or gas fuel consisting of, or derived from biomass. These fuels are produced from any carbon source that can be replenished rapidly e.g. plants. Examples like bioethanol and biodiesel have been developed for automotive transport. However, there is widespread public debate about how carbon neutral these fuels are, a key consideration for their long-term environmental viability.
Read more about: Decoding E-Fuels: 14 Crucial Facts Shaping the Future of the Internal Combustion Engine

10. **The Dominance of Liquid Transportation Fuels: Why Energy Density Matters**A crucial factor in transportation engineering is the predominance of liquid fuels. Most transportation fuels are liquids, because vehicles usually require high energy density. This inherent property allows for a greater amount of energy to be stored in a smaller volume, essential for the compact designs and operational range demanded by modern vehicles.
The synergy between liquid fuels and internal combustion engines further cements their utility. These engines thrive on clean-burning fuels, a characteristic where liquids and gases excel. Liquid fuels precisely meet the dual requirements of being both energy-dense and clean-burning, making them an optimal choice for efficient energy conversion within a vehicle’s powertrain.
Beyond their chemical properties, liquid fuels offer significant practical advantages in terms of handling and distribution. They can be pumped, which means handling is easily mechanized, and thus less laborious compared to solids. This ease of mechanized transfer facilitates rapid refueling at service stations, contributing to the convenience and widespread adoption of liquid-fueled vehicles.
Common liquid fuels in transportation include gasoline, conventional diesel—a mixture of aliphatic hydrocarbons extracted from petroleum—and LP gas, which is a blend of propane and butane. These fuels are highly versatile; for example, kerosene is used as a fuel for cooking, heating, and small engines, while LP gas and compressed propane are seeing increased use in motorized vehicles. Despite their current dominance, the use of liquid fuels such as hydrocarbons is coming under scrutiny amidst a global shift towards a low carbon economy.

11. **Fossil Fuels and Their Environmental Footprint: Beyond MPG to Global Impact**Fossil fuels, encompassing coal, petroleum, and natural gas, are hydrocarbons formed from the fossilized remains of ancient plants and animals over millions of years under immense heat and pressure within the Earth’s crust. These mineral fuels have become the predominant energy source for contemporary society, underpinning much of the world’s infrastructure and transportation systems.
A defining characteristic of fossil fuels is their status as non-renewable resources. They require geological timescales to form, yet reserves are being depleted much faster than new ones are being made. In 2007, petroleum 36.0%, coal 27.4%, and natural gas 23.0% collectively accounted for an 86.4% share for fossil fuels in primary energy consumption in the world, illustrating their widespread but unsustainable reliance. This rapid consumption necessitates judicious use and conservation efforts.
The environmental implications of fossil fuel combustion are a critical concern. Burning these fuels releases substantial amounts of carbon dioxide (CO2), a potent greenhouse gas. Annually, around 21.3 billion tonnes (21.3 gigatonnes) of carbon dioxide are produced, with natural processes capable of absorbing only about half of that amount, resulting in a significant net increase in atmospheric CO2. This accumulation enhances radiative forcing and contributes to global warming, prompting urgent global action.
In response to these environmental challenges, a global movement toward the generation of renewable energy is therefore under way. The International Energy Agency (IEA) recently predicted that fossil fuel prices will decline, with oil stabilizing around $75 to $80 per barrel as electric vehicle adoption surges and renewable energy expands. Furthermore, the IEA anticipates a notable increase in liquefied natural gas capacity, enhancing Europe’s energy diversification, suggesting a complex transition in the global energy landscape.

12. **Understanding Energy Capacity: What the Numbers on Your Fuel Really Mean**When assessing fuel efficiency claims, it is critical to grasp the underlying science of how fuels release energy. The amount of energy from different types of fuel depends on the stoichiometric ratio, which is the chemically ideal air and fuel ratio to ensure complete combustion of fuel, and its specific energy, representing the energy produced per unit mass. These two factors dictate a fuel’s intrinsic power potential.
Specific energy quantifies the energy stored within a given fuel, measured in megajoules per kilogram (MJ/kg). Equally important is the air-fuel ratio (AFR), which indicates the mass ratio of air to fuel needed for an engine to burn the fuel completely. The concept of λ (lambda) as the air-fuel equivalence ratio, where λ=1 means that it is assumed that the fuel and the oxidising agent (oxygen in air) are present in exactly the correct proportions so that they are both fully consumed in the reaction.
Examining the energy capacities of common fuels reveals significant differences that directly influence real-world performance. For instance, Hydrogen boasts the highest specific energy at 142 MJ/kg, vastly surpassing Gasoline at 46.4 MJ/kg or Diesel at 48 MJ/kg. While diesel has a slightly higher specific energy than gasoline, its air-fuel ratio means gasoline often delivers a marginally better energy output per kilogram of air. These figures illustrate the inherent efficiency variations dictated by fuel chemistry.
Understanding these intrinsic energy values and optimal air-fuel ratios provides consumers with a more robust framework for evaluating vehicle specifications. It clarifies that MPG ratings are not solely a function of vehicle design but are profoundly influenced by the very chemical makeup of the fuel being consumed. This foundational knowledge helps bridge the gap between advertised efficiency and the complex realities of energy conversion.
The journey to accurately assess fuel efficiency claims is complex, navigating a landscape fraught with testing intricacies, automaker reporting, and the undeniable variables of real-world driving. From the standardized lab conditions of EPA testing to the unique dynamics of hybrid powertrains and the fundamental energy content of different fuels, every aspect plays a role in shaping a vehicle’s actual MPG. By understanding these multifaceted factors—from the self-testing mechanisms to the precise chemical properties of fuel—consumers can arm themselves with the knowledge to make more informed decisions, manage expectations realistically, and ultimately, find a vehicle that truly aligns with their personal efficiency goals. The “joke” should never be on the consumer; instead, informed awareness empowers a clearer path forward in the quest for genuine fuel economy.


